Immigrants from Egypt vs Romanian Female Unemployment
COMPARE
Immigrants from Egypt
Romanian
Female Unemployment
Female Unemployment Comparison
Immigrants from Egypt
Romanians
5.2%
FEMALE UNEMPLOYMENT
70.0/ 100
METRIC RATING
155th/ 347
METRIC RANK
5.0%
FEMALE UNEMPLOYMENT
95.9/ 100
METRIC RATING
92nd/ 347
METRIC RANK
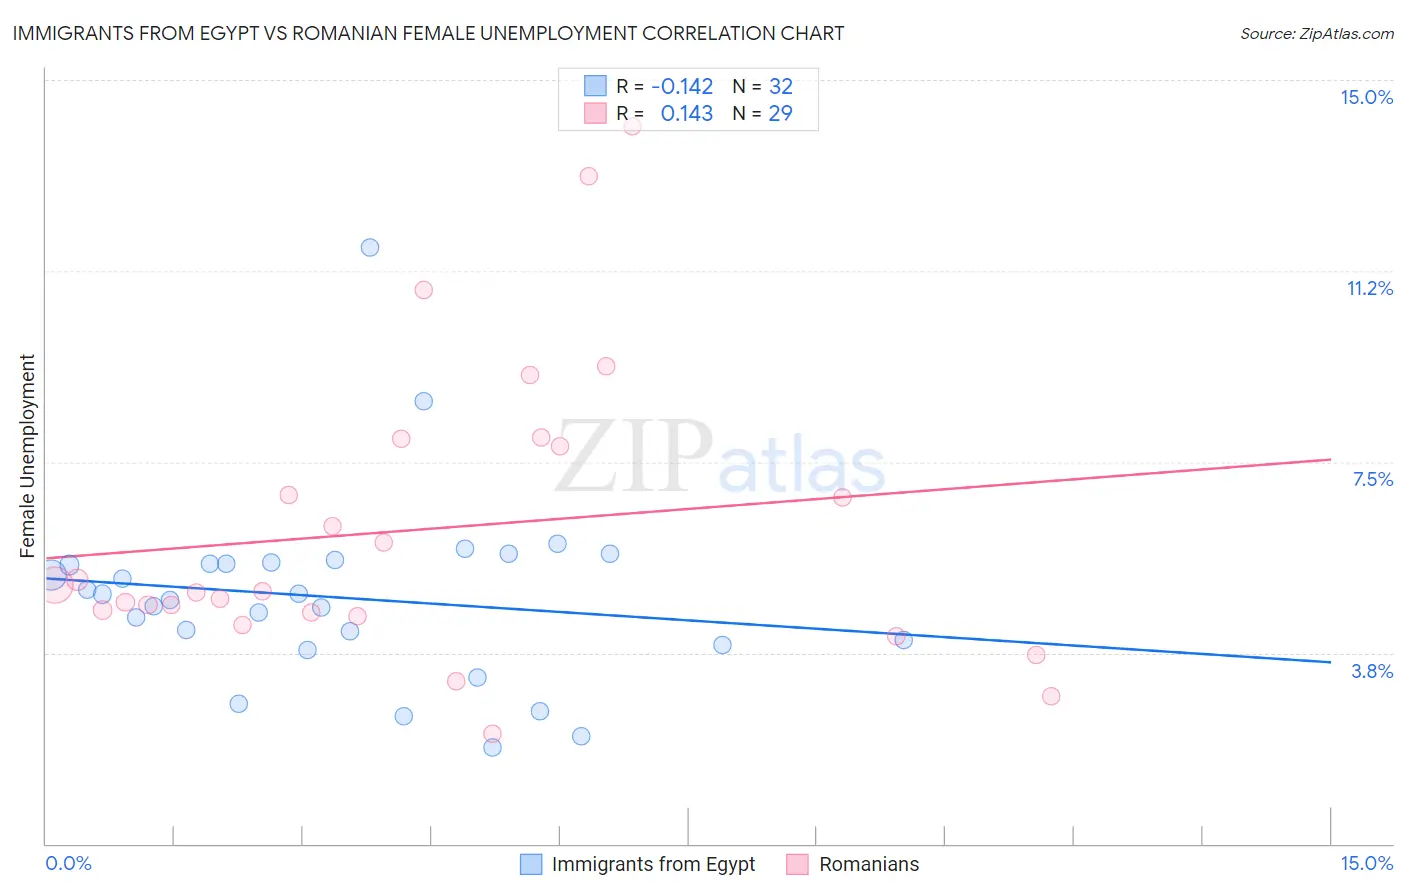
Immigrants from Egypt vs Romanian Female Unemployment Correlation Chart
The statistical analysis conducted on geographies consisting of 245,194,116 people shows a poor negative correlation between the proportion of Immigrants from Egypt and unemploymnet rate among females in the United States with a correlation coefficient (R) of -0.142 and weighted average of 5.2%. Similarly, the statistical analysis conducted on geographies consisting of 376,152,929 people shows a poor positive correlation between the proportion of Romanians and unemploymnet rate among females in the United States with a correlation coefficient (R) of 0.143 and weighted average of 5.0%, a difference of 3.6%.
Female Unemployment Correlation Summary
| Measurement | Immigrants from Egypt | Romanian |
| Minimum | 1.9% | 2.1% |
| Maximum | 11.7% | 14.1% |
| Range | 9.8% | 12.0% |
| Mean | 4.8% | 6.2% |
| Median | 4.8% | 5.0% |
| Interquartile 25% (IQ1) | 4.0% | 4.5% |
| Interquartile 75% (IQ3) | 5.5% | 7.9% |
| Interquartile Range (IQR) | 1.6% | 3.4% |
| Standard Deviation (Sample) | 1.8% | 2.9% |
| Standard Deviation (Population) | 1.8% | 2.8% |
Similar Demographics by Female Unemployment
Demographics Similar to Immigrants from Egypt by Female Unemployment
In terms of female unemployment, the demographic groups most similar to Immigrants from Egypt are Immigrants from Northern Africa (5.2%, a difference of 0.030%), Immigrants from Russia (5.2%, a difference of 0.050%), South African (5.2%, a difference of 0.060%), Albanian (5.2%, a difference of 0.12%), and Immigrants from Micronesia (5.2%, a difference of 0.22%).
| Demographics | Rating | Rank | Female Unemployment |
| Immigrants | Argentina | 78.7 /100 | #148 | Good 5.2% |
| Asians | 78.3 /100 | #149 | Good 5.2% |
| Egyptians | 78.3 /100 | #150 | Good 5.2% |
| Immigrants | China | 75.9 /100 | #151 | Good 5.2% |
| Immigrants | Italy | 75.0 /100 | #152 | Good 5.2% |
| Immigrants | Greece | 74.9 /100 | #153 | Good 5.2% |
| South Africans | 70.8 /100 | #154 | Good 5.2% |
| Immigrants | Egypt | 70.0 /100 | #155 | Good 5.2% |
| Immigrants | Northern Africa | 69.6 /100 | #156 | Good 5.2% |
| Immigrants | Russia | 69.3 /100 | #157 | Good 5.2% |
| Albanians | 68.3 /100 | #158 | Good 5.2% |
| Immigrants | Micronesia | 66.9 /100 | #159 | Good 5.2% |
| Immigrants | Spain | 66.8 /100 | #160 | Good 5.2% |
| Immigrants | Pakistan | 66.7 /100 | #161 | Good 5.2% |
| Potawatomi | 65.9 /100 | #162 | Good 5.2% |
Demographics Similar to Romanians by Female Unemployment
In terms of female unemployment, the demographic groups most similar to Romanians are Immigrants from Japan (5.0%, a difference of 0.030%), Immigrants from Austria (5.0%, a difference of 0.080%), Immigrants from Malaysia (5.0%, a difference of 0.10%), Burmese (5.0%, a difference of 0.12%), and Immigrants from Sweden (5.0%, a difference of 0.14%).
| Demographics | Rating | Rank | Female Unemployment |
| Ukrainians | 97.1 /100 | #85 | Exceptional 5.0% |
| Bolivians | 97.1 /100 | #86 | Exceptional 5.0% |
| Venezuelans | 96.9 /100 | #87 | Exceptional 5.0% |
| Immigrants | Sudan | 96.7 /100 | #88 | Exceptional 5.0% |
| Immigrants | Taiwan | 96.6 /100 | #89 | Exceptional 5.0% |
| Immigrants | Sweden | 96.3 /100 | #90 | Exceptional 5.0% |
| Immigrants | Japan | 96.0 /100 | #91 | Exceptional 5.0% |
| Romanians | 95.9 /100 | #92 | Exceptional 5.0% |
| Immigrants | Austria | 95.7 /100 | #93 | Exceptional 5.0% |
| Immigrants | Malaysia | 95.7 /100 | #94 | Exceptional 5.0% |
| Burmese | 95.6 /100 | #95 | Exceptional 5.0% |
| Immigrants | South Central Asia | 95.5 /100 | #96 | Exceptional 5.0% |
| Immigrants | Somalia | 95.2 /100 | #97 | Exceptional 5.0% |
| Immigrants | Kuwait | 95.2 /100 | #98 | Exceptional 5.0% |
| Immigrants | Zaire | 95.2 /100 | #99 | Exceptional 5.0% |