Immigrants from Egypt vs Hopi Male Unemployment
COMPARE
Immigrants from Egypt
Hopi
Male Unemployment
Male Unemployment Comparison
Immigrants from Egypt
Hopi
5.2%
MALE UNEMPLOYMENT
65.9/ 100
METRIC RATING
162nd/ 347
METRIC RANK
10.8%
MALE UNEMPLOYMENT
0.0/ 100
METRIC RATING
344th/ 347
METRIC RANK
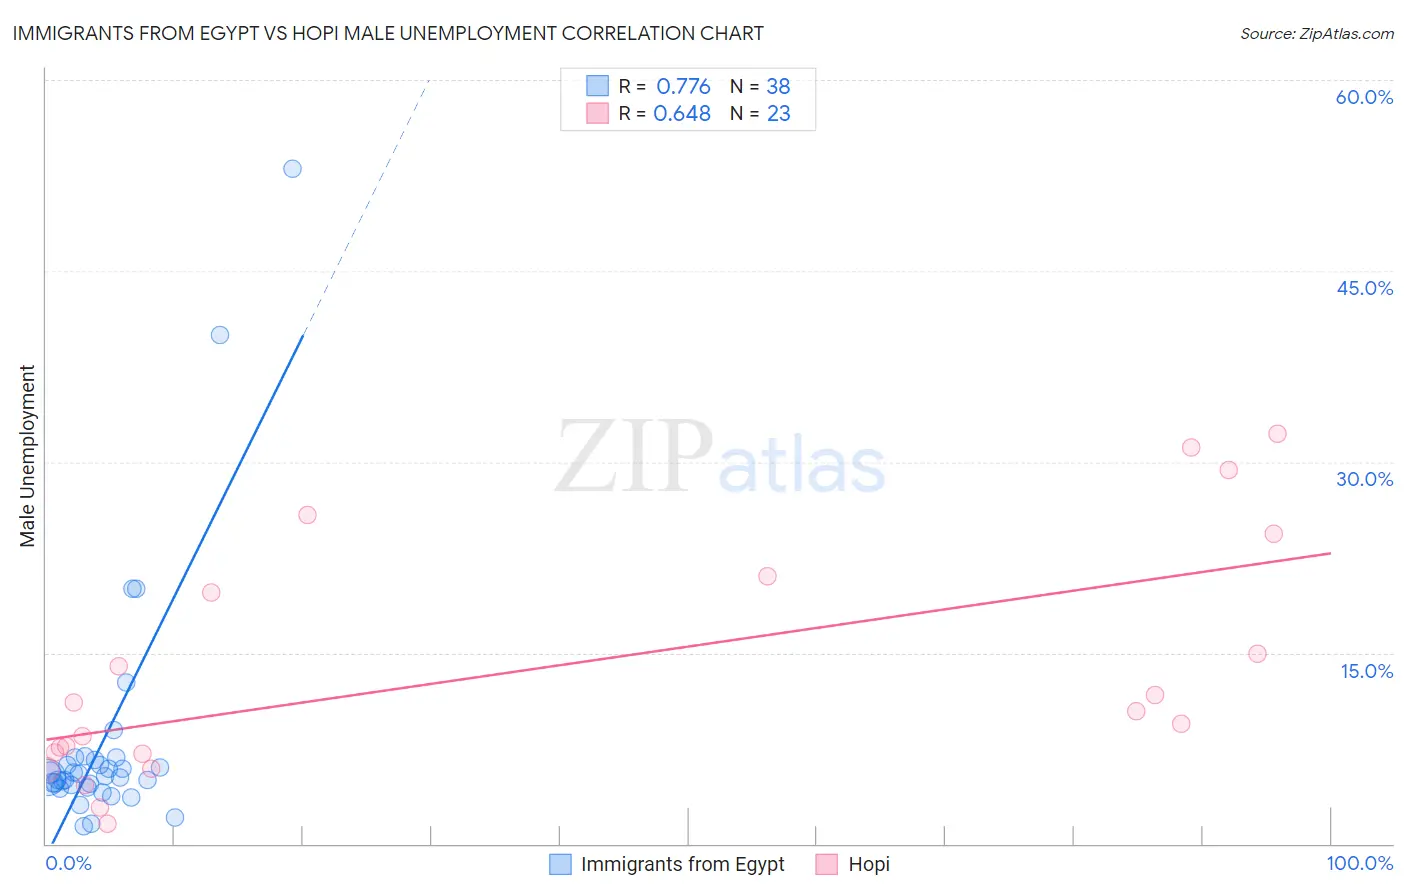
Immigrants from Egypt vs Hopi Male Unemployment Correlation Chart
The statistical analysis conducted on geographies consisting of 245,171,994 people shows a strong positive correlation between the proportion of Immigrants from Egypt and unemployment rate among males in the United States with a correlation coefficient (R) of 0.776 and weighted average of 5.2%. Similarly, the statistical analysis conducted on geographies consisting of 74,646,198 people shows a significant positive correlation between the proportion of Hopi and unemployment rate among males in the United States with a correlation coefficient (R) of 0.648 and weighted average of 10.8%, a difference of 105.7%.
Male Unemployment Correlation Summary
| Measurement | Immigrants from Egypt | Hopi |
| Minimum | 1.4% | 1.6% |
| Maximum | 53.0% | 32.2% |
| Range | 51.6% | 30.6% |
| Mean | 8.2% | 13.6% |
| Median | 5.3% | 10.4% |
| Interquartile 25% (IQ1) | 4.6% | 7.0% |
| Interquartile 75% (IQ3) | 6.6% | 21.0% |
| Interquartile Range (IQR) | 2.0% | 14.0% |
| Standard Deviation (Sample) | 10.0% | 9.4% |
| Standard Deviation (Population) | 9.9% | 9.2% |
Similar Demographics by Male Unemployment
Demographics Similar to Immigrants from Egypt by Male Unemployment
In terms of male unemployment, the demographic groups most similar to Immigrants from Egypt are Immigrants from Hong Kong (5.2%, a difference of 0.010%), Afghan (5.3%, a difference of 0.25%), Immigrants from China (5.2%, a difference of 0.32%), South American (5.3%, a difference of 0.33%), and Immigrants from Norway (5.2%, a difference of 0.35%).
| Demographics | Rating | Rank | Male Unemployment |
| Immigrants | Hungary | 73.4 /100 | #155 | Good 5.2% |
| Americans | 72.7 /100 | #156 | Good 5.2% |
| Immigrants | Northern Africa | 72.3 /100 | #157 | Good 5.2% |
| Immigrants | Indonesia | 71.5 /100 | #158 | Good 5.2% |
| Indonesians | 71.2 /100 | #159 | Good 5.2% |
| Immigrants | Norway | 71.0 /100 | #160 | Good 5.2% |
| Immigrants | China | 70.6 /100 | #161 | Good 5.2% |
| Immigrants | Egypt | 65.9 /100 | #162 | Good 5.2% |
| Immigrants | Hong Kong | 65.7 /100 | #163 | Good 5.2% |
| Afghans | 62.0 /100 | #164 | Good 5.3% |
| South Americans | 60.6 /100 | #165 | Good 5.3% |
| Immigrants | Morocco | 60.2 /100 | #166 | Good 5.3% |
| Immigrants | Vietnam | 58.1 /100 | #167 | Average 5.3% |
| Immigrants | Ireland | 57.7 /100 | #168 | Average 5.3% |
| Immigrants | Congo | 57.4 /100 | #169 | Average 5.3% |
Demographics Similar to Hopi by Male Unemployment
In terms of male unemployment, the demographic groups most similar to Hopi are Crow (10.6%, a difference of 1.7%), Arapaho (11.0%, a difference of 2.0%), Tohono O'odham (10.2%, a difference of 6.1%), Navajo (9.8%, a difference of 9.7%), and Alaskan Athabascan (9.8%, a difference of 10.0%).
| Demographics | Rating | Rank | Male Unemployment |
| Sioux | 0.0 /100 | #333 | Tragic 8.4% |
| Tsimshian | 0.0 /100 | #334 | Tragic 8.5% |
| Pueblo | 0.0 /100 | #335 | Tragic 8.5% |
| Yuman | 0.0 /100 | #336 | Tragic 8.6% |
| Puerto Ricans | 0.0 /100 | #337 | Tragic 8.6% |
| Apache | 0.0 /100 | #338 | Tragic 8.6% |
| Cheyenne | 0.0 /100 | #339 | Tragic 9.8% |
| Alaskan Athabascans | 0.0 /100 | #340 | Tragic 9.8% |
| Navajo | 0.0 /100 | #341 | Tragic 9.8% |
| Tohono O'odham | 0.0 /100 | #342 | Tragic 10.2% |
| Crow | 0.0 /100 | #343 | Tragic 10.6% |
| Hopi | 0.0 /100 | #344 | Tragic 10.8% |
| Arapaho | 0.0 /100 | #345 | Tragic 11.0% |
| Inupiat | 0.0 /100 | #346 | Tragic 12.1% |
| Yup'ik | 0.0 /100 | #347 | Tragic 16.4% |