Immigrants from Egypt vs Immigrants from Moldova Unemployment Among Women with Children Under 6 years
COMPARE
Immigrants from Egypt
Immigrants from Moldova
Unemployment Among Women with Children Under 6 years
Unemployment Among Women with Children Under 6 years Comparison
Immigrants from Egypt
Immigrants from Moldova
7.2%
UNEMPLOYMENT AMONG WOMEN WITH CHILDREN UNDER 6 YEARS
97.2/ 100
METRIC RATING
104th/ 347
METRIC RANK
6.6%
UNEMPLOYMENT AMONG WOMEN WITH CHILDREN UNDER 6 YEARS
100.0/ 100
METRIC RATING
31st/ 347
METRIC RANK
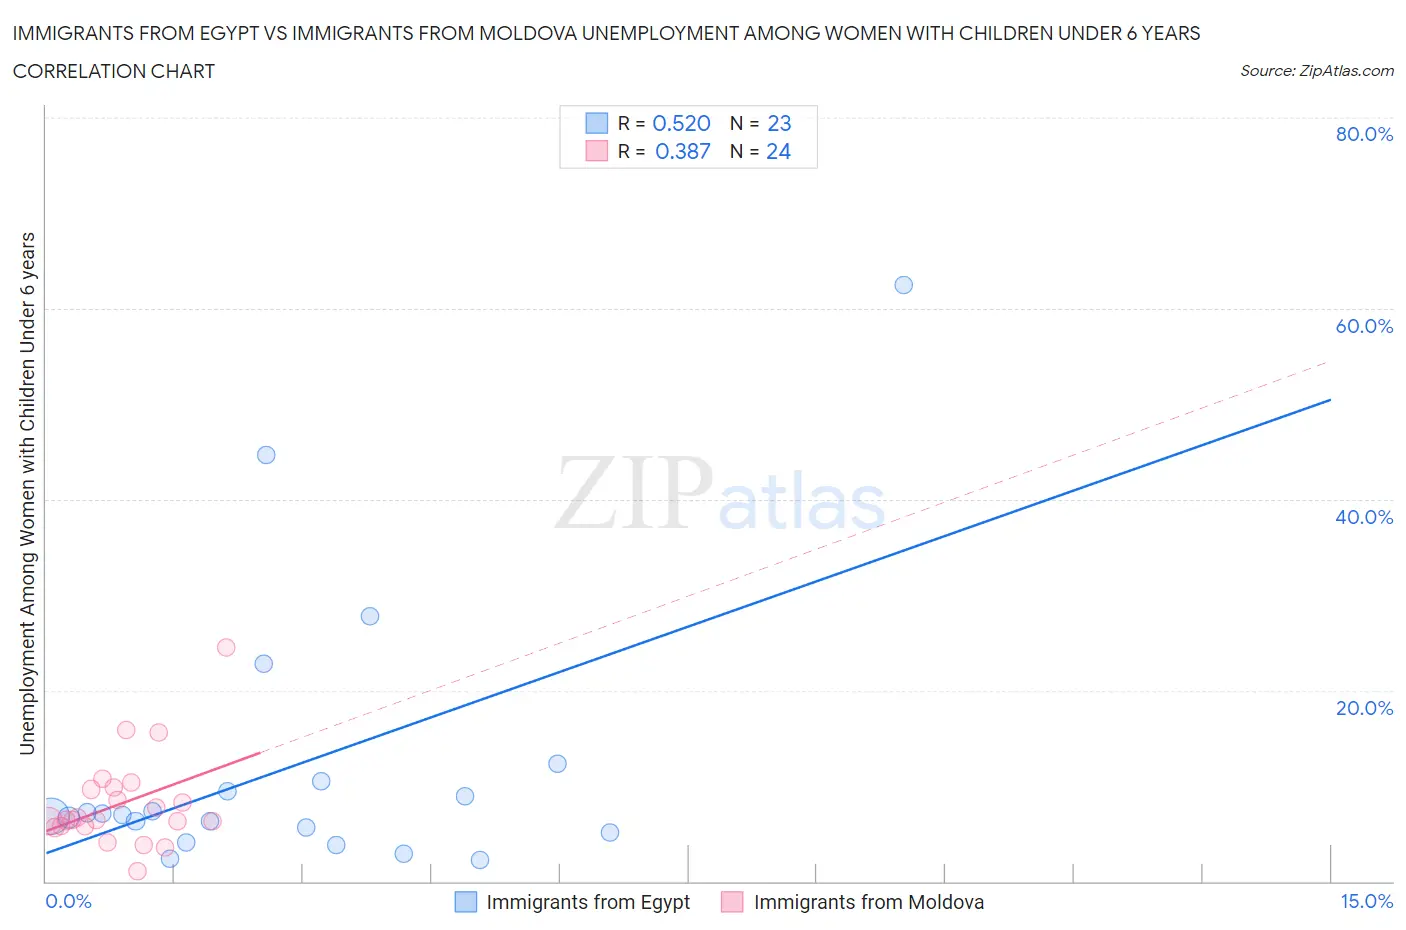
Immigrants from Egypt vs Immigrants from Moldova Unemployment Among Women with Children Under 6 years Correlation Chart
The statistical analysis conducted on geographies consisting of 202,245,410 people shows a substantial positive correlation between the proportion of Immigrants from Egypt and unemployment rate among women with children under the age of 6 in the United States with a correlation coefficient (R) of 0.520 and weighted average of 7.2%. Similarly, the statistical analysis conducted on geographies consisting of 108,789,886 people shows a mild positive correlation between the proportion of Immigrants from Moldova and unemployment rate among women with children under the age of 6 in the United States with a correlation coefficient (R) of 0.387 and weighted average of 6.6%, a difference of 9.0%.
Unemployment Among Women with Children Under 6 years Correlation Summary
| Measurement | Immigrants from Egypt | Immigrants from Moldova |
| Minimum | 2.2% | 1.0% |
| Maximum | 62.5% | 24.5% |
| Range | 60.3% | 23.5% |
| Mean | 12.2% | 8.1% |
| Median | 7.0% | 6.5% |
| Interquartile 25% (IQ1) | 5.1% | 5.8% |
| Interquartile 75% (IQ3) | 10.5% | 9.7% |
| Interquartile Range (IQR) | 5.4% | 3.9% |
| Standard Deviation (Sample) | 14.6% | 4.9% |
| Standard Deviation (Population) | 14.3% | 4.8% |
Similar Demographics by Unemployment Among Women with Children Under 6 years
Demographics Similar to Immigrants from Egypt by Unemployment Among Women with Children Under 6 years
In terms of unemployment among women with children under 6 years, the demographic groups most similar to Immigrants from Egypt are Venezuelan (7.2%, a difference of 0.010%), Immigrants from Pakistan (7.2%, a difference of 0.030%), Immigrants from Kazakhstan (7.2%, a difference of 0.040%), Immigrants from Nicaragua (7.2%, a difference of 0.080%), and Immigrants from Saudi Arabia (7.2%, a difference of 0.080%).
| Demographics | Rating | Rank | Unemployment Among Women with Children Under 6 years |
| Immigrants | South Eastern Asia | 97.6 /100 | #97 | Exceptional 7.2% |
| Russians | 97.5 /100 | #98 | Exceptional 7.2% |
| Immigrants | Europe | 97.5 /100 | #99 | Exceptional 7.2% |
| Immigrants | Northern Europe | 97.4 /100 | #100 | Exceptional 7.2% |
| Chileans | 97.4 /100 | #101 | Exceptional 7.2% |
| Immigrants | Nicaragua | 97.3 /100 | #102 | Exceptional 7.2% |
| Immigrants | Saudi Arabia | 97.3 /100 | #103 | Exceptional 7.2% |
| Immigrants | Egypt | 97.2 /100 | #104 | Exceptional 7.2% |
| Venezuelans | 97.2 /100 | #105 | Exceptional 7.2% |
| Immigrants | Pakistan | 97.2 /100 | #106 | Exceptional 7.2% |
| Immigrants | Kazakhstan | 97.1 /100 | #107 | Exceptional 7.2% |
| Eastern Europeans | 96.9 /100 | #108 | Exceptional 7.2% |
| Australians | 96.9 /100 | #109 | Exceptional 7.2% |
| Palestinians | 96.8 /100 | #110 | Exceptional 7.2% |
| Norwegians | 96.7 /100 | #111 | Exceptional 7.2% |
Demographics Similar to Immigrants from Moldova by Unemployment Among Women with Children Under 6 years
In terms of unemployment among women with children under 6 years, the demographic groups most similar to Immigrants from Moldova are Tsimshian (6.6%, a difference of 0.070%), Immigrants from Vietnam (6.6%, a difference of 0.080%), Immigrants from South Central Asia (6.6%, a difference of 0.090%), Immigrants from Belarus (6.6%, a difference of 0.29%), and Yakama (6.6%, a difference of 0.36%).
| Demographics | Rating | Rank | Unemployment Among Women with Children Under 6 years |
| Laotians | 100.0 /100 | #24 | Exceptional 6.5% |
| Soviet Union | 100.0 /100 | #25 | Exceptional 6.5% |
| Cypriots | 100.0 /100 | #26 | Exceptional 6.5% |
| Immigrants | Japan | 100.0 /100 | #27 | Exceptional 6.5% |
| Immigrants | Israel | 100.0 /100 | #28 | Exceptional 6.5% |
| Immigrants | Sweden | 100.0 /100 | #29 | Exceptional 6.6% |
| Immigrants | Belarus | 100.0 /100 | #30 | Exceptional 6.6% |
| Immigrants | Moldova | 100.0 /100 | #31 | Exceptional 6.6% |
| Tsimshian | 100.0 /100 | #32 | Exceptional 6.6% |
| Immigrants | Vietnam | 100.0 /100 | #33 | Exceptional 6.6% |
| Immigrants | South Central Asia | 100.0 /100 | #34 | Exceptional 6.6% |
| Yakama | 100.0 /100 | #35 | Exceptional 6.6% |
| Luxembourgers | 100.0 /100 | #36 | Exceptional 6.6% |
| Sri Lankans | 100.0 /100 | #37 | Exceptional 6.6% |
| Hmong | 100.0 /100 | #38 | Exceptional 6.7% |