Immigrants from England vs Maltese Unemployment
COMPARE
Immigrants from England
Maltese
Unemployment
Unemployment Comparison
Immigrants from England
Maltese
5.0%
UNEMPLOYMENT
95.2/ 100
METRIC RATING
96th/ 347
METRIC RANK
5.0%
UNEMPLOYMENT
94.0/ 100
METRIC RATING
105th/ 347
METRIC RANK
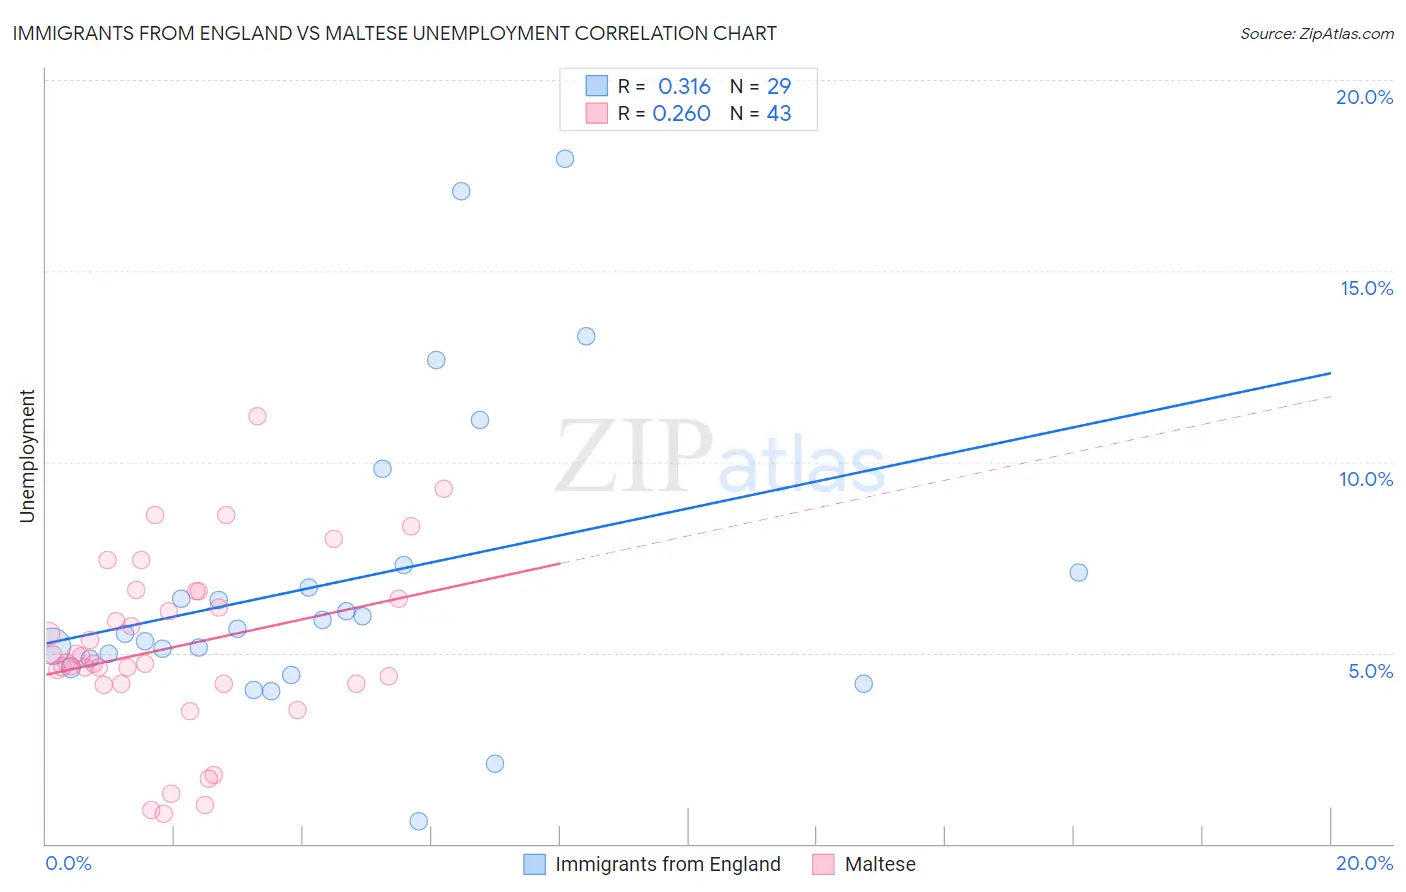
Immigrants from England vs Maltese Unemployment Correlation Chart
The statistical analysis conducted on geographies consisting of 391,444,946 people shows a mild positive correlation between the proportion of Immigrants from England and unemployment in the United States with a correlation coefficient (R) of 0.316 and weighted average of 5.0%. Similarly, the statistical analysis conducted on geographies consisting of 126,436,055 people shows a weak positive correlation between the proportion of Maltese and unemployment in the United States with a correlation coefficient (R) of 0.260 and weighted average of 5.0%, a difference of 0.37%.
Unemployment Correlation Summary
| Measurement | Immigrants from England | Maltese |
| Minimum | 0.60% | 0.80% |
| Maximum | 17.9% | 11.2% |
| Range | 17.3% | 10.4% |
| Mean | 6.9% | 5.2% |
| Median | 5.6% | 4.7% |
| Interquartile 25% (IQ1) | 4.7% | 4.2% |
| Interquartile 75% (IQ3) | 7.2% | 6.6% |
| Interquartile Range (IQR) | 2.5% | 2.4% |
| Standard Deviation (Sample) | 4.0% | 2.3% |
| Standard Deviation (Population) | 3.9% | 2.3% |
Demographics Similar to Immigrants from England and Maltese by Unemployment
In terms of unemployment, the demographic groups most similar to Immigrants from England are Immigrants from Czechoslovakia (5.0%, a difference of 0.030%), Romanian (5.0%, a difference of 0.060%), Mongolian (5.0%, a difference of 0.13%), Immigrants from Serbia (5.0%, a difference of 0.16%), and Estonian (5.0%, a difference of 0.19%). Similarly, the demographic groups most similar to Maltese are Chickasaw (5.0%, a difference of 0.0%), Osage (5.0%, a difference of 0.0%), Immigrants from Argentina (5.0%, a difference of 0.040%), Immigrants from Romania (5.0%, a difference of 0.070%), and Immigrants from Turkey (5.0%, a difference of 0.080%).
| Demographics | Rating | Rank | Unemployment |
| Immigrants | North Macedonia | 96.3 /100 | #90 | Exceptional 5.0% |
| Immigrants | Sudan | 96.3 /100 | #91 | Exceptional 5.0% |
| Immigrants | South Africa | 96.2 /100 | #92 | Exceptional 5.0% |
| Ukrainians | 96.0 /100 | #93 | Exceptional 5.0% |
| Immigrants | Austria | 95.9 /100 | #94 | Exceptional 5.0% |
| Immigrants | Serbia | 95.6 /100 | #95 | Exceptional 5.0% |
| Immigrants | England | 95.2 /100 | #96 | Exceptional 5.0% |
| Immigrants | Czechoslovakia | 95.1 /100 | #97 | Exceptional 5.0% |
| Romanians | 95.0 /100 | #98 | Exceptional 5.0% |
| Mongolians | 94.8 /100 | #99 | Exceptional 5.0% |
| Estonians | 94.6 /100 | #100 | Exceptional 5.0% |
| Americans | 94.3 /100 | #101 | Exceptional 5.0% |
| Immigrants | Argentina | 94.1 /100 | #102 | Exceptional 5.0% |
| Chickasaw | 94.0 /100 | #103 | Exceptional 5.0% |
| Osage | 94.0 /100 | #104 | Exceptional 5.0% |
| Maltese | 94.0 /100 | #105 | Exceptional 5.0% |
| Immigrants | Romania | 93.7 /100 | #106 | Exceptional 5.0% |
| Immigrants | Turkey | 93.7 /100 | #107 | Exceptional 5.0% |
| Immigrants | Kuwait | 93.7 /100 | #108 | Exceptional 5.0% |
| Immigrants | Eritrea | 93.3 /100 | #109 | Exceptional 5.0% |
| Immigrants | Lithuania | 93.2 /100 | #110 | Exceptional 5.0% |