Immigrants from Eastern Africa vs Ethiopian Unemployment Among Ages 30 to 34 years
COMPARE
Immigrants from Eastern Africa
Ethiopian
Unemployment Among Ages 30 to 34 years
Unemployment Among Ages 30 to 34 years Comparison
Immigrants from Eastern Africa
Ethiopians
5.0%
UNEMPLOYMENT AMONG AGES 30 TO 34 YEARS
98.9/ 100
METRIC RATING
41st/ 347
METRIC RANK
4.9%
UNEMPLOYMENT AMONG AGES 30 TO 34 YEARS
99.8/ 100
METRIC RATING
21st/ 347
METRIC RANK
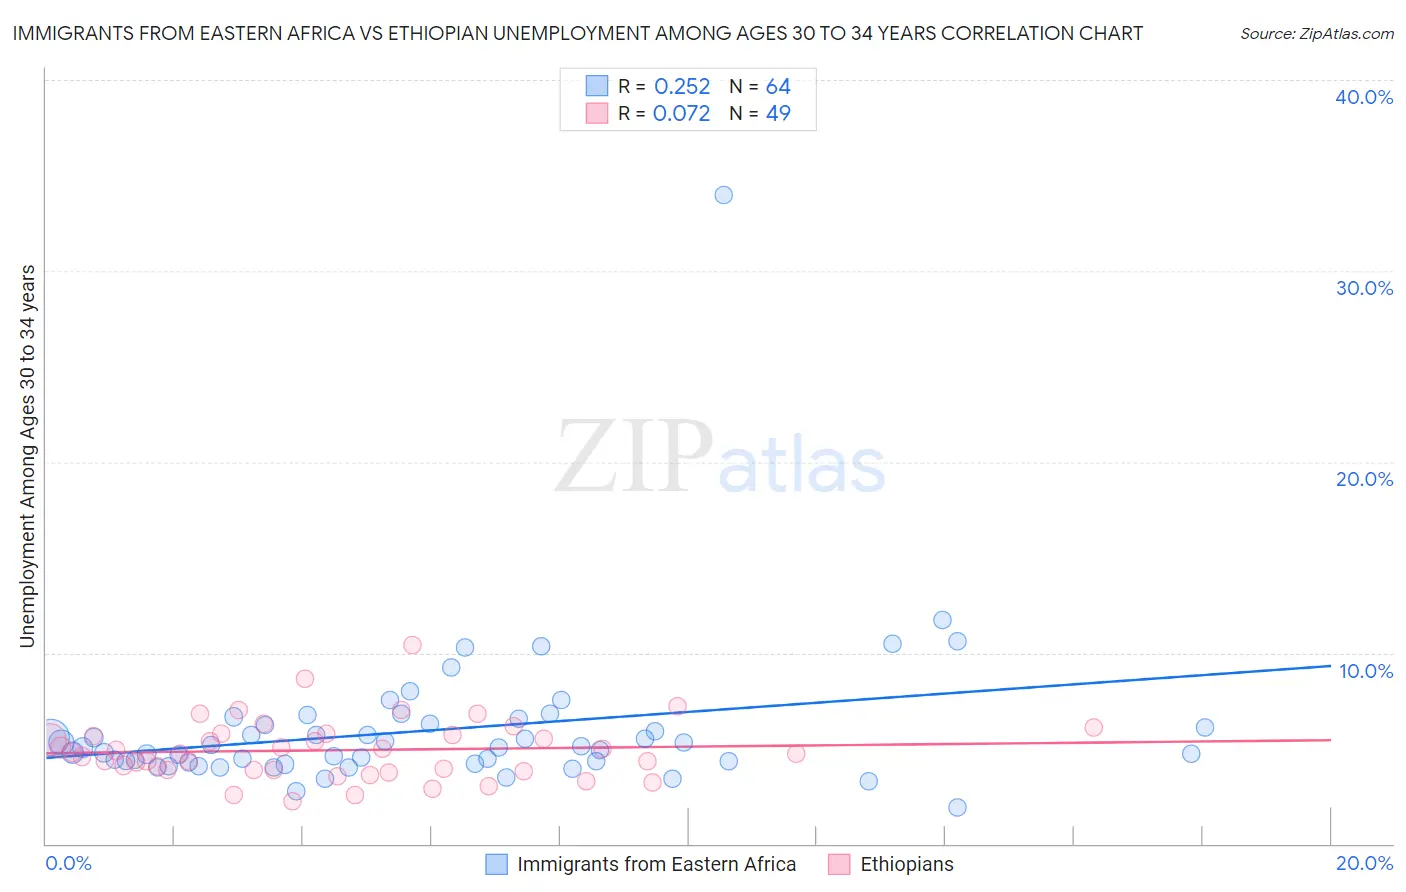
Immigrants from Eastern Africa vs Ethiopian Unemployment Among Ages 30 to 34 years Correlation Chart
The statistical analysis conducted on geographies consisting of 339,538,992 people shows a weak positive correlation between the proportion of Immigrants from Eastern Africa and unemployment rate among population between the ages 30 and 34 in the United States with a correlation coefficient (R) of 0.252 and weighted average of 5.0%. Similarly, the statistical analysis conducted on geographies consisting of 217,247,468 people shows a slight positive correlation between the proportion of Ethiopians and unemployment rate among population between the ages 30 and 34 in the United States with a correlation coefficient (R) of 0.072 and weighted average of 4.9%, a difference of 3.5%.
Unemployment Among Ages 30 to 34 years Correlation Summary
| Measurement | Immigrants from Eastern Africa | Ethiopian |
| Minimum | 1.9% | 2.2% |
| Maximum | 34.0% | 10.4% |
| Range | 32.1% | 8.2% |
| Mean | 5.9% | 4.9% |
| Median | 5.0% | 4.7% |
| Interquartile 25% (IQ1) | 4.3% | 3.9% |
| Interquartile 75% (IQ3) | 6.2% | 5.7% |
| Interquartile Range (IQR) | 2.0% | 1.9% |
| Standard Deviation (Sample) | 4.1% | 1.6% |
| Standard Deviation (Population) | 4.0% | 1.6% |
Demographics Similar to Immigrants from Eastern Africa and Ethiopians by Unemployment Among Ages 30 to 34 years
In terms of unemployment among ages 30 to 34 years, the demographic groups most similar to Immigrants from Eastern Africa are Immigrants from Vietnam (5.0%, a difference of 0.0%), Fijian (5.0%, a difference of 0.080%), Immigrants from Turkey (5.0%, a difference of 0.19%), Sri Lankan (5.0%, a difference of 0.19%), and Czech (5.0%, a difference of 0.44%). Similarly, the demographic groups most similar to Ethiopians are Immigrants from South Central Asia (4.9%, a difference of 0.21%), Hmong (4.9%, a difference of 0.38%), Ugandan (4.9%, a difference of 0.94%), Immigrants from Singapore (5.0%, a difference of 1.9%), and Immigrants from Kuwait (5.0%, a difference of 2.0%).
| Demographics | Rating | Rank | Unemployment Among Ages 30 to 34 years |
| Ethiopians | 99.8 /100 | #21 | Exceptional 4.9% |
| Immigrants | South Central Asia | 99.8 /100 | #22 | Exceptional 4.9% |
| Hmong | 99.8 /100 | #23 | Exceptional 4.9% |
| Ugandans | 99.7 /100 | #24 | Exceptional 4.9% |
| Immigrants | Singapore | 99.5 /100 | #25 | Exceptional 5.0% |
| Immigrants | Kuwait | 99.5 /100 | #26 | Exceptional 5.0% |
| Danes | 99.5 /100 | #27 | Exceptional 5.0% |
| Immigrants | Cuba | 99.4 /100 | #28 | Exceptional 5.0% |
| German Russians | 99.4 /100 | #29 | Exceptional 5.0% |
| Norwegians | 99.4 /100 | #30 | Exceptional 5.0% |
| Somalis | 99.3 /100 | #31 | Exceptional 5.0% |
| Immigrants | Zaire | 99.3 /100 | #32 | Exceptional 5.0% |
| Immigrants | Saudi Arabia | 99.3 /100 | #33 | Exceptional 5.0% |
| Latvians | 99.3 /100 | #34 | Exceptional 5.0% |
| Immigrants | Ethiopia | 99.2 /100 | #35 | Exceptional 5.0% |
| Czechs | 99.2 /100 | #36 | Exceptional 5.0% |
| Immigrants | Turkey | 99.0 /100 | #37 | Exceptional 5.0% |
| Sri Lankans | 99.0 /100 | #38 | Exceptional 5.0% |
| Fijians | 99.0 /100 | #39 | Exceptional 5.0% |
| Immigrants | Vietnam | 98.9 /100 | #40 | Exceptional 5.0% |
| Immigrants | Eastern Africa | 98.9 /100 | #41 | Exceptional 5.0% |