Latvian vs Cajun Female Unemployment
COMPARE
Latvian
Cajun
Female Unemployment
Female Unemployment Comparison
Latvians
Cajuns
4.7%
FEMALE UNEMPLOYMENT
99.9/ 100
METRIC RATING
18th/ 347
METRIC RANK
5.7%
FEMALE UNEMPLOYMENT
0.7/ 100
METRIC RATING
252nd/ 347
METRIC RANK
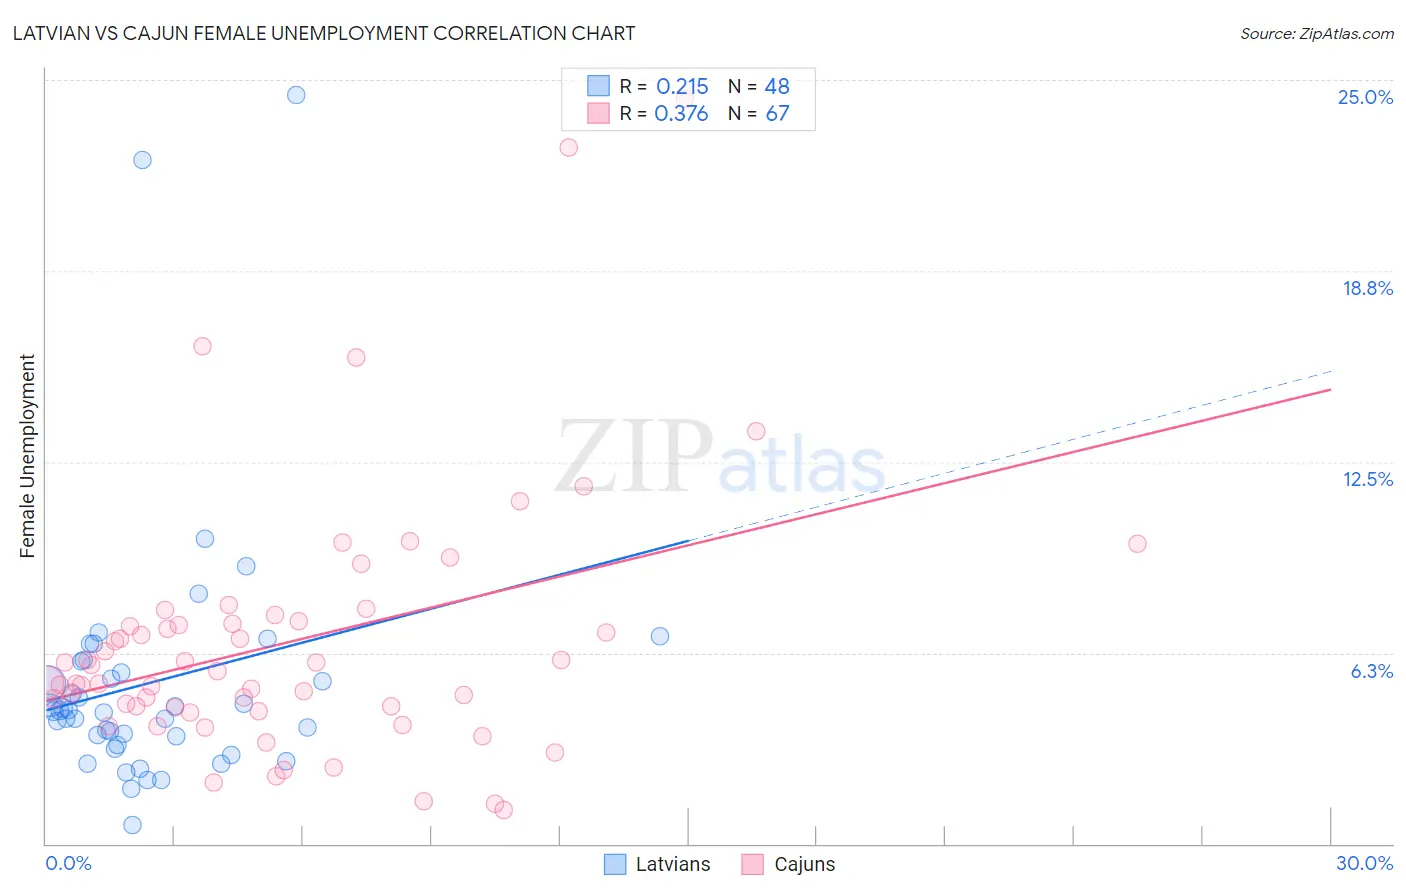
Latvian vs Cajun Female Unemployment Correlation Chart
The statistical analysis conducted on geographies consisting of 220,201,927 people shows a weak positive correlation between the proportion of Latvians and unemploymnet rate among females in the United States with a correlation coefficient (R) of 0.215 and weighted average of 4.7%. Similarly, the statistical analysis conducted on geographies consisting of 149,152,884 people shows a mild positive correlation between the proportion of Cajuns and unemploymnet rate among females in the United States with a correlation coefficient (R) of 0.376 and weighted average of 5.7%, a difference of 20.8%.
Female Unemployment Correlation Summary
| Measurement | Latvian | Cajun |
| Minimum | 0.60% | 1.1% |
| Maximum | 24.5% | 24.4% |
| Range | 23.9% | 23.3% |
| Mean | 5.3% | 6.6% |
| Median | 4.3% | 5.6% |
| Interquartile 25% (IQ1) | 3.4% | 4.4% |
| Interquartile 75% (IQ3) | 5.8% | 7.3% |
| Interquartile Range (IQR) | 2.4% | 2.8% |
| Standard Deviation (Sample) | 4.3% | 4.3% |
| Standard Deviation (Population) | 4.2% | 4.2% |
Similar Demographics by Female Unemployment
Demographics Similar to Latvians by Female Unemployment
In terms of female unemployment, the demographic groups most similar to Latvians are Polish (4.7%, a difference of 0.010%), Bulgarian (4.7%, a difference of 0.090%), Fijian (4.7%, a difference of 0.10%), European (4.7%, a difference of 0.12%), and Croatian (4.7%, a difference of 0.14%).
| Demographics | Rating | Rank | Female Unemployment |
| Scandinavians | 100.0 /100 | #11 | Exceptional 4.6% |
| Dutch | 100.0 /100 | #12 | Exceptional 4.6% |
| Belgians | 100.0 /100 | #13 | Exceptional 4.6% |
| Finns | 100.0 /100 | #14 | Exceptional 4.6% |
| English | 100.0 /100 | #15 | Exceptional 4.6% |
| Carpatho Rusyns | 99.9 /100 | #16 | Exceptional 4.7% |
| Croatians | 99.9 /100 | #17 | Exceptional 4.7% |
| Latvians | 99.9 /100 | #18 | Exceptional 4.7% |
| Poles | 99.9 /100 | #19 | Exceptional 4.7% |
| Bulgarians | 99.9 /100 | #20 | Exceptional 4.7% |
| Fijians | 99.9 /100 | #21 | Exceptional 4.7% |
| Europeans | 99.9 /100 | #22 | Exceptional 4.7% |
| Scottish | 99.9 /100 | #23 | Exceptional 4.7% |
| Welsh | 99.9 /100 | #24 | Exceptional 4.7% |
| Immigrants | India | 99.9 /100 | #25 | Exceptional 4.7% |
Demographics Similar to Cajuns by Female Unemployment
In terms of female unemployment, the demographic groups most similar to Cajuns are Immigrants from Sierra Leone (5.7%, a difference of 0.15%), Immigrants (5.7%, a difference of 0.15%), Immigrants from Cameroon (5.7%, a difference of 0.18%), Assyrian/Chaldean/Syriac (5.6%, a difference of 0.20%), and Immigrants from Syria (5.6%, a difference of 0.26%).
| Demographics | Rating | Rank | Female Unemployment |
| Guamanians/Chamorros | 1.4 /100 | #245 | Tragic 5.6% |
| Japanese | 1.2 /100 | #246 | Tragic 5.6% |
| Immigrants | Western Asia | 1.1 /100 | #247 | Tragic 5.6% |
| Cree | 1.0 /100 | #248 | Tragic 5.6% |
| Immigrants | Uzbekistan | 1.0 /100 | #249 | Tragic 5.6% |
| Immigrants | Syria | 0.8 /100 | #250 | Tragic 5.6% |
| Assyrians/Chaldeans/Syriacs | 0.8 /100 | #251 | Tragic 5.6% |
| Cajuns | 0.7 /100 | #252 | Tragic 5.7% |
| Immigrants | Sierra Leone | 0.6 /100 | #253 | Tragic 5.7% |
| Immigrants | Immigrants | 0.6 /100 | #254 | Tragic 5.7% |
| Immigrants | Cameroon | 0.6 /100 | #255 | Tragic 5.7% |
| Sub-Saharan Africans | 0.4 /100 | #256 | Tragic 5.7% |
| Dutch West Indians | 0.3 /100 | #257 | Tragic 5.7% |
| Immigrants | Portugal | 0.2 /100 | #258 | Tragic 5.8% |
| Immigrants | Fiji | 0.2 /100 | #259 | Tragic 5.8% |