Immigrants from Dominican Republic vs South American Unemployment Among Ages 25 to 29 years
COMPARE
Immigrants from Dominican Republic
South American
Unemployment Among Ages 25 to 29 years
Unemployment Among Ages 25 to 29 years Comparison
Immigrants from Dominican Republic
South Americans
8.6%
UNEMPLOYMENT AMONG AGES 25 TO 29 YEARS
0.0/ 100
METRIC RATING
321st/ 347
METRIC RANK
6.6%
UNEMPLOYMENT AMONG AGES 25 TO 29 YEARS
54.5/ 100
METRIC RATING
169th/ 347
METRIC RANK
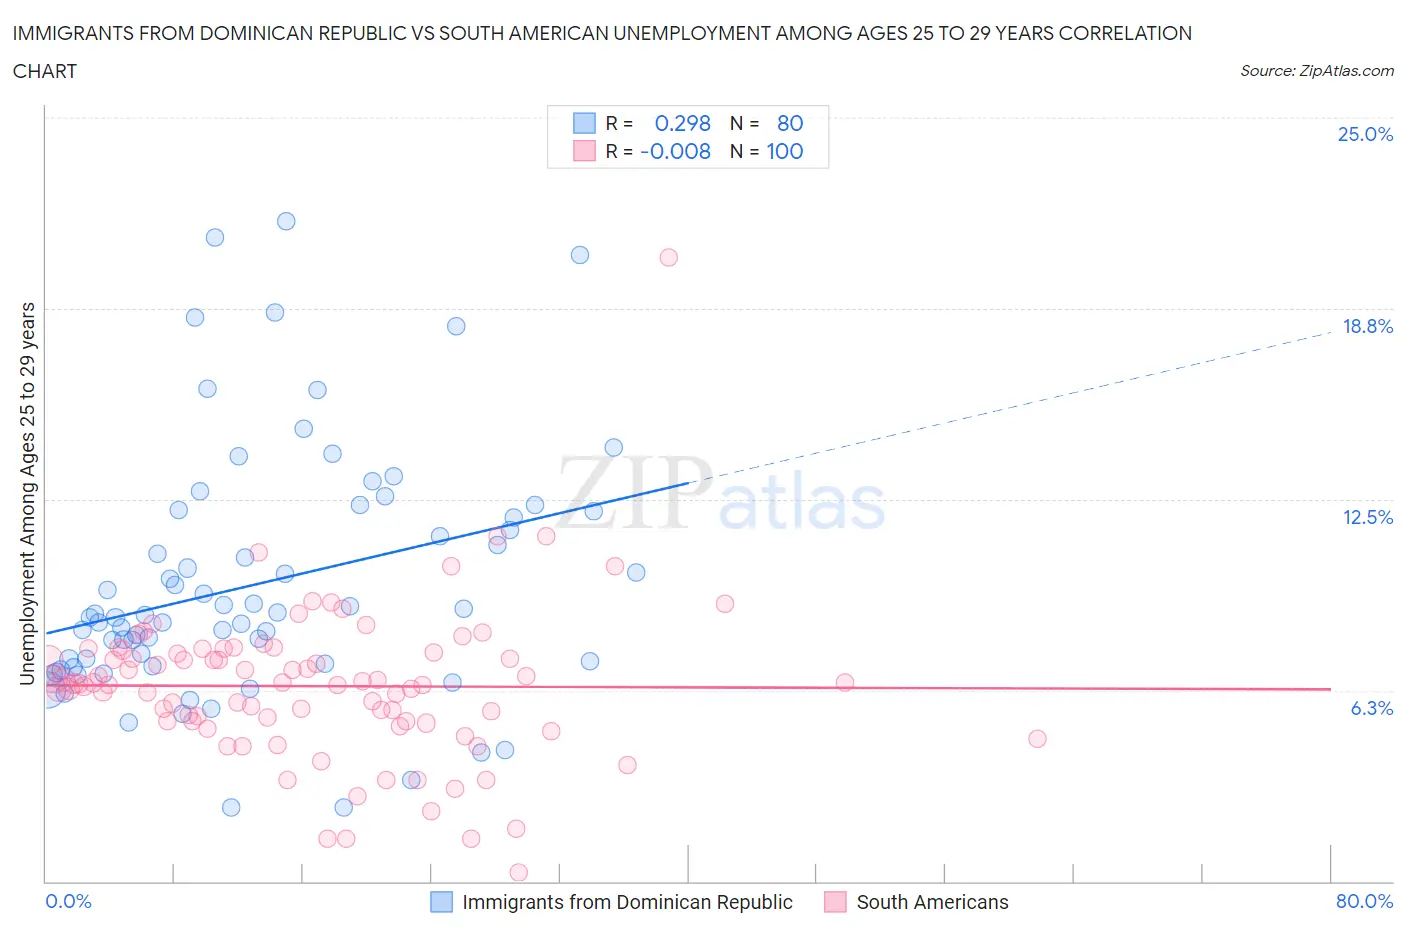
Immigrants from Dominican Republic vs South American Unemployment Among Ages 25 to 29 years Correlation Chart
The statistical analysis conducted on geographies consisting of 264,956,049 people shows a weak positive correlation between the proportion of Immigrants from Dominican Republic and unemployment rate among population between the ages 25 and 29 in the United States with a correlation coefficient (R) of 0.298 and weighted average of 8.6%. Similarly, the statistical analysis conducted on geographies consisting of 460,796,066 people shows no correlation between the proportion of South Americans and unemployment rate among population between the ages 25 and 29 in the United States with a correlation coefficient (R) of -0.008 and weighted average of 6.6%, a difference of 29.9%.
Unemployment Among Ages 25 to 29 years Correlation Summary
| Measurement | Immigrants from Dominican Republic | South American |
| Minimum | 2.4% | 0.30% |
| Maximum | 21.6% | 20.4% |
| Range | 19.2% | 20.1% |
| Mean | 9.7% | 6.4% |
| Median | 8.7% | 6.5% |
| Interquartile 25% (IQ1) | 7.1% | 5.2% |
| Interquartile 75% (IQ3) | 12.0% | 7.5% |
| Interquartile Range (IQR) | 4.9% | 2.3% |
| Standard Deviation (Sample) | 4.1% | 2.5% |
| Standard Deviation (Population) | 4.0% | 2.5% |
Similar Demographics by Unemployment Among Ages 25 to 29 years
Demographics Similar to Immigrants from Dominican Republic by Unemployment Among Ages 25 to 29 years
In terms of unemployment among ages 25 to 29 years, the demographic groups most similar to Immigrants from Dominican Republic are Black/African American (8.6%, a difference of 0.61%), Tlingit-Haida (8.7%, a difference of 0.78%), Dominican (8.7%, a difference of 0.88%), Houma (8.7%, a difference of 1.2%), and Immigrants from Armenia (8.5%, a difference of 1.4%).
| Demographics | Rating | Rank | Unemployment Among Ages 25 to 29 years |
| Immigrants | Dominica | 0.0 /100 | #314 | Tragic 8.4% |
| British West Indians | 0.0 /100 | #315 | Tragic 8.4% |
| Immigrants | Grenada | 0.0 /100 | #316 | Tragic 8.4% |
| Immigrants | Guyana | 0.0 /100 | #317 | Tragic 8.5% |
| Guyanese | 0.0 /100 | #318 | Tragic 8.5% |
| Immigrants | Armenia | 0.0 /100 | #319 | Tragic 8.5% |
| Blacks/African Americans | 0.0 /100 | #320 | Tragic 8.6% |
| Immigrants | Dominican Republic | 0.0 /100 | #321 | Tragic 8.6% |
| Tlingit-Haida | 0.0 /100 | #322 | Tragic 8.7% |
| Dominicans | 0.0 /100 | #323 | Tragic 8.7% |
| Houma | 0.0 /100 | #324 | Tragic 8.7% |
| Yakama | 0.0 /100 | #325 | Tragic 8.8% |
| Shoshone | 0.0 /100 | #326 | Tragic 9.2% |
| Colville | 0.0 /100 | #327 | Tragic 9.2% |
| Apache | 0.0 /100 | #328 | Tragic 9.5% |
Demographics Similar to South Americans by Unemployment Among Ages 25 to 29 years
In terms of unemployment among ages 25 to 29 years, the demographic groups most similar to South Americans are Estonian (6.6%, a difference of 0.020%), Immigrants from Canada (6.6%, a difference of 0.030%), Albanian (6.6%, a difference of 0.060%), Immigrants from Cambodia (6.6%, a difference of 0.12%), and Immigrants from Northern Europe (6.6%, a difference of 0.18%).
| Demographics | Rating | Rank | Unemployment Among Ages 25 to 29 years |
| Immigrants | Czechoslovakia | 60.2 /100 | #162 | Good 6.6% |
| Immigrants | Middle Africa | 59.4 /100 | #163 | Average 6.6% |
| Greeks | 58.5 /100 | #164 | Average 6.6% |
| English | 58.0 /100 | #165 | Average 6.6% |
| Immigrants | Northern Europe | 57.3 /100 | #166 | Average 6.6% |
| Immigrants | Canada | 55.0 /100 | #167 | Average 6.6% |
| Estonians | 54.8 /100 | #168 | Average 6.6% |
| South Americans | 54.5 /100 | #169 | Average 6.6% |
| Albanians | 53.5 /100 | #170 | Average 6.6% |
| Immigrants | Cambodia | 52.6 /100 | #171 | Average 6.6% |
| Bangladeshis | 51.6 /100 | #172 | Average 6.6% |
| Russians | 51.3 /100 | #173 | Average 6.6% |
| Immigrants | North America | 50.0 /100 | #174 | Average 6.6% |
| Immigrants | South Eastern Asia | 49.1 /100 | #175 | Average 6.7% |
| Osage | 48.1 /100 | #176 | Average 6.7% |