Immigrants from Dominican Republic vs Cheyenne Unemployment Among Women with Children Under 18 years
COMPARE
Immigrants from Dominican Republic
Cheyenne
Unemployment Among Women with Children Under 18 years
Unemployment Among Women with Children Under 18 years Comparison
Immigrants from Dominican Republic
Cheyenne
7.5%
UNEMPLOYMENT AMONG WOMEN WITH CHILDREN UNDER 18 YEARS
0.0/ 100
METRIC RATING
333rd/ 347
METRIC RANK
7.8%
UNEMPLOYMENT AMONG WOMEN WITH CHILDREN UNDER 18 YEARS
0.0/ 100
METRIC RATING
334th/ 347
METRIC RANK
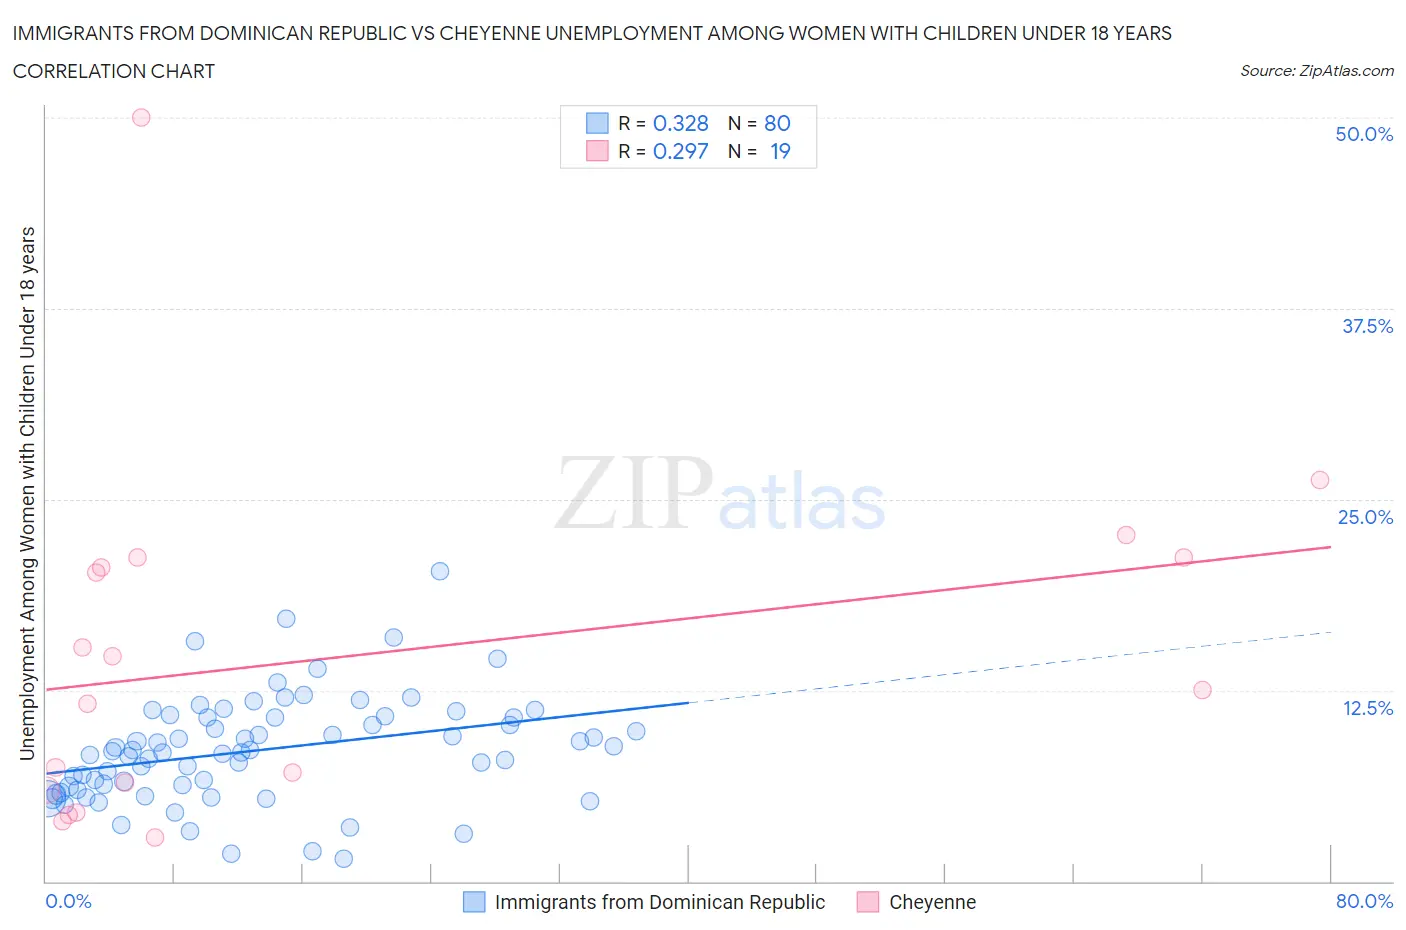
Immigrants from Dominican Republic vs Cheyenne Unemployment Among Women with Children Under 18 years Correlation Chart
The statistical analysis conducted on geographies consisting of 268,233,481 people shows a mild positive correlation between the proportion of Immigrants from Dominican Republic and unemployment rate among women with children under the age of 18 in the United States with a correlation coefficient (R) of 0.328 and weighted average of 7.5%. Similarly, the statistical analysis conducted on geographies consisting of 79,481,561 people shows a weak positive correlation between the proportion of Cheyenne and unemployment rate among women with children under the age of 18 in the United States with a correlation coefficient (R) of 0.297 and weighted average of 7.8%, a difference of 4.6%.
Unemployment Among Women with Children Under 18 years Correlation Summary
| Measurement | Immigrants from Dominican Republic | Cheyenne |
| Minimum | 1.5% | 2.9% |
| Maximum | 20.3% | 50.0% |
| Range | 18.8% | 47.1% |
| Mean | 8.6% | 14.7% |
| Median | 8.5% | 12.5% |
| Interquartile 25% (IQ1) | 6.1% | 6.0% |
| Interquartile 75% (IQ3) | 10.7% | 21.2% |
| Interquartile Range (IQR) | 4.6% | 15.2% |
| Standard Deviation (Sample) | 3.5% | 11.4% |
| Standard Deviation (Population) | 3.5% | 11.1% |
Demographics Similar to Immigrants from Dominican Republic and Cheyenne by Unemployment Among Women with Children Under 18 years
In terms of unemployment among women with children under 18 years, the demographic groups most similar to Immigrants from Dominican Republic are Dominican (7.5%, a difference of 0.36%), Hopi (7.4%, a difference of 0.90%), Colville (7.4%, a difference of 1.5%), Black/African American (7.3%, a difference of 2.9%), and Native/Alaskan (7.2%, a difference of 3.4%). Similarly, the demographic groups most similar to Cheyenne are Apache (7.9%, a difference of 0.98%), Sioux (7.9%, a difference of 1.3%), Yakama (8.1%, a difference of 2.7%), Immigrants from Yemen (8.2%, a difference of 4.4%), and Navajo (8.2%, a difference of 4.9%).
| Demographics | Rating | Rank | Unemployment Among Women with Children Under 18 years |
| Pueblo | 0.0 /100 | #323 | Tragic 6.8% |
| Paiute | 0.0 /100 | #324 | Tragic 6.9% |
| Immigrants | Dominica | 0.0 /100 | #325 | Tragic 7.0% |
| Chippewa | 0.0 /100 | #326 | Tragic 7.0% |
| Lumbee | 0.0 /100 | #327 | Tragic 7.1% |
| Natives/Alaskans | 0.0 /100 | #328 | Tragic 7.2% |
| Blacks/African Americans | 0.0 /100 | #329 | Tragic 7.3% |
| Colville | 0.0 /100 | #330 | Tragic 7.4% |
| Hopi | 0.0 /100 | #331 | Tragic 7.4% |
| Dominicans | 0.0 /100 | #332 | Tragic 7.5% |
| Immigrants | Dominican Republic | 0.0 /100 | #333 | Tragic 7.5% |
| Cheyenne | 0.0 /100 | #334 | Tragic 7.8% |
| Apache | 0.0 /100 | #335 | Tragic 7.9% |
| Sioux | 0.0 /100 | #336 | Tragic 7.9% |
| Yakama | 0.0 /100 | #337 | Tragic 8.1% |
| Immigrants | Yemen | 0.0 /100 | #338 | Tragic 8.2% |
| Navajo | 0.0 /100 | #339 | Tragic 8.2% |
| Crow | 0.0 /100 | #340 | Tragic 8.2% |
| Tohono O'odham | 0.0 /100 | #341 | Tragic 8.9% |
| Puerto Ricans | 0.0 /100 | #342 | Tragic 9.0% |
| Arapaho | 0.0 /100 | #343 | Tragic 9.2% |