Immigrants from Dominican Republic vs Immigrants from Romania Unemployment Among Women with Children Under 18 years
COMPARE
Immigrants from Dominican Republic
Immigrants from Romania
Unemployment Among Women with Children Under 18 years
Unemployment Among Women with Children Under 18 years Comparison
Immigrants from Dominican Republic
Immigrants from Romania
7.5%
UNEMPLOYMENT AMONG WOMEN WITH CHILDREN UNDER 18 YEARS
0.0/ 100
METRIC RATING
333rd/ 347
METRIC RANK
5.3%
UNEMPLOYMENT AMONG WOMEN WITH CHILDREN UNDER 18 YEARS
85.8/ 100
METRIC RATING
121st/ 347
METRIC RANK
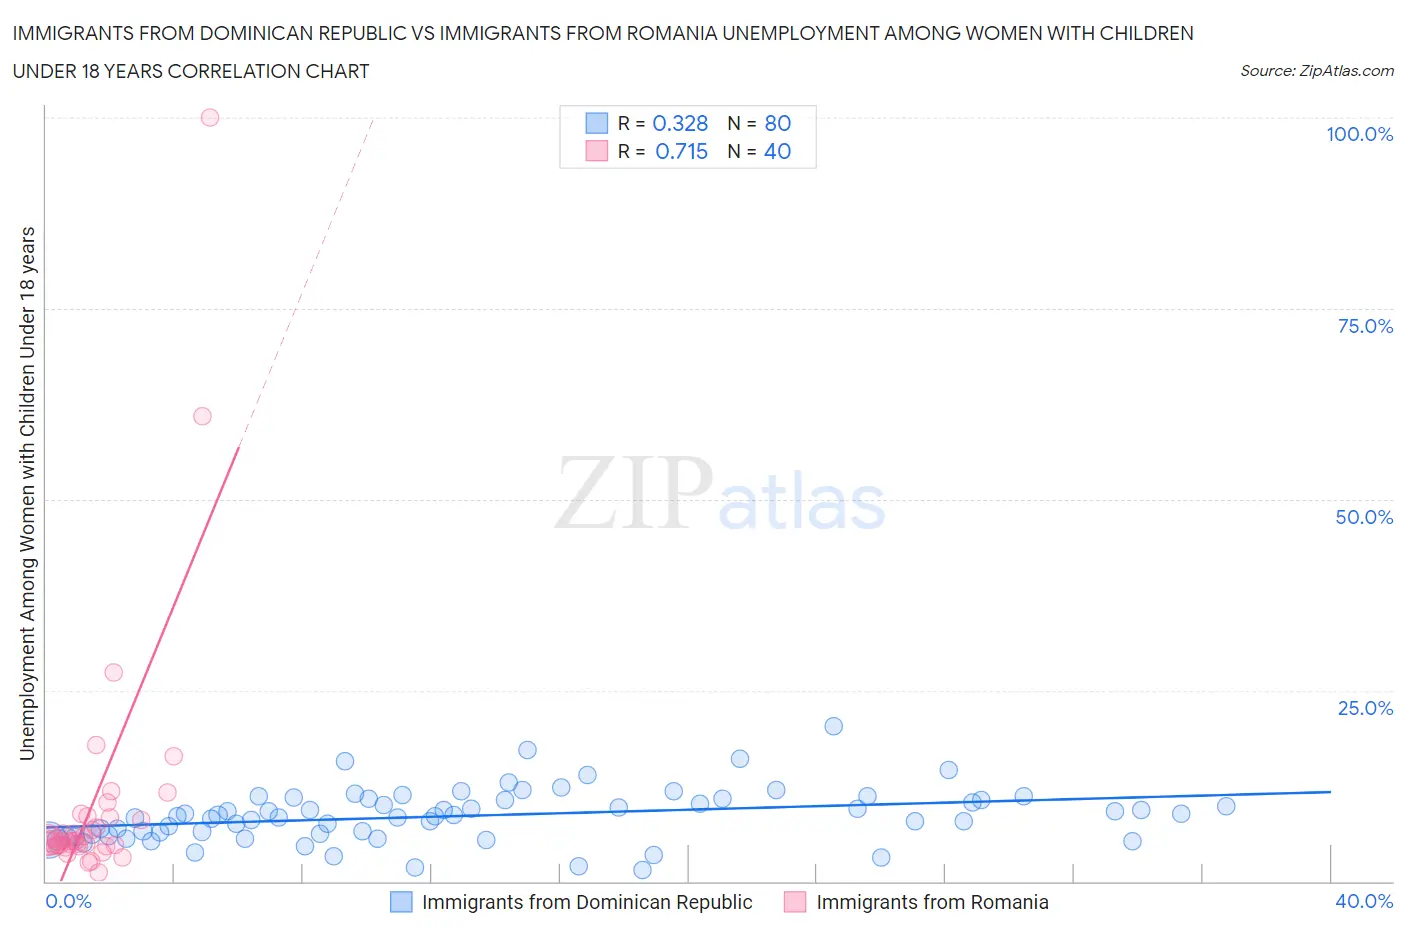
Immigrants from Dominican Republic vs Immigrants from Romania Unemployment Among Women with Children Under 18 years Correlation Chart
The statistical analysis conducted on geographies consisting of 268,233,481 people shows a mild positive correlation between the proportion of Immigrants from Dominican Republic and unemployment rate among women with children under the age of 18 in the United States with a correlation coefficient (R) of 0.328 and weighted average of 7.5%. Similarly, the statistical analysis conducted on geographies consisting of 251,032,591 people shows a strong positive correlation between the proportion of Immigrants from Romania and unemployment rate among women with children under the age of 18 in the United States with a correlation coefficient (R) of 0.715 and weighted average of 5.3%, a difference of 42.1%.
Unemployment Among Women with Children Under 18 years Correlation Summary
| Measurement | Immigrants from Dominican Republic | Immigrants from Romania |
| Minimum | 1.5% | 1.2% |
| Maximum | 20.3% | 100.0% |
| Range | 18.8% | 98.8% |
| Mean | 8.6% | 10.6% |
| Median | 8.5% | 5.3% |
| Interquartile 25% (IQ1) | 6.1% | 4.7% |
| Interquartile 75% (IQ3) | 10.7% | 8.5% |
| Interquartile Range (IQR) | 4.6% | 3.8% |
| Standard Deviation (Sample) | 3.5% | 17.5% |
| Standard Deviation (Population) | 3.5% | 17.3% |
Similar Demographics by Unemployment Among Women with Children Under 18 years
Demographics Similar to Immigrants from Dominican Republic by Unemployment Among Women with Children Under 18 years
In terms of unemployment among women with children under 18 years, the demographic groups most similar to Immigrants from Dominican Republic are Dominican (7.5%, a difference of 0.36%), Hopi (7.4%, a difference of 0.90%), Colville (7.4%, a difference of 1.5%), Black/African American (7.3%, a difference of 2.9%), and Native/Alaskan (7.2%, a difference of 3.4%).
| Demographics | Rating | Rank | Unemployment Among Women with Children Under 18 years |
| Chippewa | 0.0 /100 | #326 | Tragic 7.0% |
| Lumbee | 0.0 /100 | #327 | Tragic 7.1% |
| Natives/Alaskans | 0.0 /100 | #328 | Tragic 7.2% |
| Blacks/African Americans | 0.0 /100 | #329 | Tragic 7.3% |
| Colville | 0.0 /100 | #330 | Tragic 7.4% |
| Hopi | 0.0 /100 | #331 | Tragic 7.4% |
| Dominicans | 0.0 /100 | #332 | Tragic 7.5% |
| Immigrants | Dominican Republic | 0.0 /100 | #333 | Tragic 7.5% |
| Cheyenne | 0.0 /100 | #334 | Tragic 7.8% |
| Apache | 0.0 /100 | #335 | Tragic 7.9% |
| Sioux | 0.0 /100 | #336 | Tragic 7.9% |
| Yakama | 0.0 /100 | #337 | Tragic 8.1% |
| Immigrants | Yemen | 0.0 /100 | #338 | Tragic 8.2% |
| Navajo | 0.0 /100 | #339 | Tragic 8.2% |
| Crow | 0.0 /100 | #340 | Tragic 8.2% |
Demographics Similar to Immigrants from Romania by Unemployment Among Women with Children Under 18 years
In terms of unemployment among women with children under 18 years, the demographic groups most similar to Immigrants from Romania are Scotch-Irish (5.3%, a difference of 0.010%), Egyptian (5.3%, a difference of 0.090%), Basque (5.3%, a difference of 0.11%), Immigrants from Europe (5.3%, a difference of 0.15%), and Sudanese (5.3%, a difference of 0.21%).
| Demographics | Rating | Rank | Unemployment Among Women with Children Under 18 years |
| Kenyans | 88.2 /100 | #114 | Excellent 5.3% |
| Hungarians | 88.1 /100 | #115 | Excellent 5.3% |
| Macedonians | 87.7 /100 | #116 | Excellent 5.3% |
| Canadians | 87.4 /100 | #117 | Excellent 5.3% |
| Immigrants | Europe | 86.7 /100 | #118 | Excellent 5.3% |
| Basques | 86.5 /100 | #119 | Excellent 5.3% |
| Egyptians | 86.4 /100 | #120 | Excellent 5.3% |
| Immigrants | Romania | 85.8 /100 | #121 | Excellent 5.3% |
| Scotch-Irish | 85.7 /100 | #122 | Excellent 5.3% |
| Sudanese | 84.3 /100 | #123 | Excellent 5.3% |
| Native Hawaiians | 84.0 /100 | #124 | Excellent 5.3% |
| Immigrants | North Macedonia | 83.2 /100 | #125 | Excellent 5.3% |
| Immigrants | Oceania | 83.1 /100 | #126 | Excellent 5.3% |
| Whites/Caucasians | 82.9 /100 | #127 | Excellent 5.3% |
| Immigrants | South Africa | 82.8 /100 | #128 | Excellent 5.3% |