Immigrants from Lithuania vs Cheyenne Unemployment Among Women with Children Under 18 years

COMPARE

Immigrants from Lithuania
Race
Ancestry
AfghanAfricanAlaska NativeAlaskan AthabascanAlbanianAleutAlsatianAmericanApacheArabArapahoArgentineanArmenianAssyrian/Chaldean/SyriacAustralianAustrianBahamianBangladeshiBarbadianBasqueBelgianBelizeanBermudanBhutaneseBlackfeetBolivianBrazilianBritishBritish West IndianBulgarianBurmeseCajunCambodianCanadianCape VerdeanCarpatho RusynCelticCentral AmericanCentral American IndianCherokeeChickasawChileanChineseChippewaChoctawColombianColvilleComancheCosta RicanCreeCreekCroatianCrowCubanCypriotCzechCzechoslovakianDanishDelawareDominicanDutchDutch West IndianEastern EuropeanEcuadorianEgyptianEnglishEstonianEthiopianEuropeanFijianFilipinoFinnishFrenchFrench American IndianFrench CanadianGermanGerman RussianGhanaianGreekGuamanian/ChamorroGuatemalanGuyaneseHaitianHmongHonduranHopiHoumaHungarianIcelanderIndian (Asian)IndonesianInupiatIranianIraqiIrishIroquoisIsraeliItalianJamaicanJapaneseJordanianKenyanKiowaKoreanLaotianLatvianLebaneseLiberianLithuanianLumbeeLuxembourgerMacedonianMalaysianMalteseMarshalleseMenomineeMexicanMexican American IndianMongolianMoroccanNative HawaiianNavajoNepaleseNew ZealanderNicaraguanNigerianNorthern EuropeanNorwegianOkinawanOsageOttawaPaiutePakistaniPalestinianPanamanianParaguayanPennsylvania GermanPeruvianPimaPolishPortuguesePotawatomiPuebloPuerto RicanPuget Sound SalishRomanianRussianSalvadoranSamoanScandinavianScotch-IrishScottishSeminoleSenegaleseSerbianShoshoneSierra LeoneanSiouxSlavicSlovakSloveneSomaliSouth AfricanSouth AmericanSouth American IndianSoviet UnionSpaniardSpanishSpanish AmericanSpanish American IndianSri LankanSubsaharan AfricanSudaneseSwedishSwissSyrianTaiwaneseThaiTlingit-HaidaTohono O'OdhamTonganTrinidadian and TobagonianTsimshianTurkishU.S. Virgin IslanderUgandanUkrainianUruguayanUteVenezuelanVietnameseWelshWest IndianYakamaYaquiYugoslavianYumanYup'ikZimbabwean
Immigration
NonimmigrantsImmigrantsAfghanistanAfricaAlbaniaArgentinaArmeniaAsiaAustraliaAustriaBahamasBangladeshBarbadosBelarusBelgiumBelizeBoliviaBosnia and HerzegovinaBrazilBulgariaBurma/MyanmarCabo VerdeCambodiaCameroonCanadaCaribbeanCentral AmericaChileChinaColombiaCongoCosta RicaCroatiaCubaCzechoslovakiaDenmarkDominicaDominican RepublicEastern AfricaEastern AsiaEastern EuropeEcuadorEgyptEl SalvadorEnglandEritreaEthiopiaEuropeFijiFranceGermanyGhanaGreeceGrenadaGuatemalaGuyanaHaitiHondurasHong KongHungaryIndiaIndonesiaIranIraqIrelandIsraelItalyJamaicaJapanJordanKazakhstanKenyaKoreaKuwaitLaosLatin AmericaLatviaLebanonLiberiaLithuaniaMalaysiaMexicoMicronesiaMiddle AfricaMoldovaMoroccoNepalNetherlandsNicaraguaNigeriaNorth AmericaNorth MacedoniaNorthern AfricaNorthern EuropeNorwayOceaniaPakistanPanamaPeruPhilippinesPolandPortugalRomaniaRussiaSaudi ArabiaScotlandSenegalSerbiaSierra LeoneSingaporeSomaliaSouth AfricaSouth AmericaSouth Central AsiaSouth Eastern AsiaSouthern EuropeSpainSri LankaSt. Vincent and the GrenadinesSudanSwedenSwitzerlandSyriaTaiwanThailandTrinidad and TobagoTurkeyUgandaUkraineUruguayUzbekistanVenezuelaVietnamWest IndiesWestern AfricaWestern AsiaWestern EuropeYemenZaireZimbabweAzores
Cheyenne
Race
Ancestry
AfghanAfricanAlaska NativeAlaskan AthabascanAlbanianAleutAlsatianAmericanApacheArabArapahoArgentineanArmenianAssyrian/Chaldean/SyriacAustralianAustrianBahamianBangladeshiBarbadianBasqueBelgianBelizeanBermudanBhutaneseBlackfeetBolivianBrazilianBritishBritish West IndianBulgarianBurmeseCajunCambodianCanadianCape VerdeanCarpatho RusynCelticCentral AmericanCentral American IndianCherokeeCheyenneChickasawChileanChineseChippewaChoctawColombianColvilleComancheCosta RicanCreeCreekCroatianCrowCubanCypriotCzechCzechoslovakianDanishDelawareDominicanDutchDutch West IndianEastern EuropeanEcuadorianEgyptianEnglishEstonianEthiopianEuropeanFijianFilipinoFinnishFrenchFrench American IndianFrench CanadianGermanGerman RussianGhanaianGreekGuamanian/ChamorroGuatemalanGuyaneseHaitianHmongHonduranHopiHoumaHungarianIcelanderIndian (Asian)IndonesianInupiatIranianIraqiIrishIroquoisIsraeliItalianJamaicanJapaneseJordanianKenyanKiowaKoreanLaotianLatvianLebaneseLiberianLithuanianLumbeeLuxembourgerMacedonianMalaysianMalteseMarshalleseMenomineeMexicanMexican American IndianMongolianMoroccanNative HawaiianNavajoNepaleseNew ZealanderNicaraguanNigerianNorthern EuropeanNorwegianOkinawanOsageOttawaPaiutePakistaniPalestinianPanamanianParaguayanPennsylvania GermanPeruvianPimaPolishPortuguesePotawatomiPuebloPuerto RicanPuget Sound SalishRomanianRussianSalvadoranSamoanScandinavianScotch-IrishScottishSeminoleSenegaleseSerbianShoshoneSierra LeoneanSiouxSlavicSlovakSloveneSomaliSouth AfricanSouth AmericanSouth American IndianSoviet UnionSpaniardSpanishSpanish AmericanSpanish American IndianSri LankanSubsaharan AfricanSudaneseSwedishSwissSyrianTaiwaneseThaiTlingit-HaidaTohono O'OdhamTonganTrinidadian and TobagonianTsimshianTurkishU.S. Virgin IslanderUgandanUkrainianUruguayanUteVenezuelanVietnameseWelshWest IndianYakamaYaquiYugoslavianYumanYup'ikZimbabwean
Immigration
NonimmigrantsImmigrantsAfghanistanAfricaAlbaniaArgentinaArmeniaAsiaAustraliaAustriaBahamasBangladeshBarbadosBelarusBelgiumBelizeBoliviaBosnia and HerzegovinaBrazilBulgariaBurma/MyanmarCabo VerdeCambodiaCameroonCanadaCaribbeanCentral AmericaChileChinaColombiaCongoCosta RicaCroatiaCubaCzechoslovakiaDenmarkDominicaDominican RepublicEastern AfricaEastern AsiaEastern EuropeEcuadorEgyptEl SalvadorEnglandEritreaEthiopiaEuropeFijiFranceGermanyGhanaGreeceGrenadaGuatemalaGuyanaHaitiHondurasHong KongHungaryIndiaIndonesiaIranIraqIrelandIsraelItalyJamaicaJapanJordanKazakhstanKenyaKoreaKuwaitLaosLatin AmericaLatviaLebanonLiberiaMalaysiaMexicoMicronesiaMiddle AfricaMoldovaMoroccoNepalNetherlandsNicaraguaNigeriaNorth AmericaNorth MacedoniaNorthern AfricaNorthern EuropeNorwayOceaniaPakistanPanamaPeruPhilippinesPolandPortugalRomaniaRussiaSaudi ArabiaScotlandSenegalSerbiaSierra LeoneSingaporeSomaliaSouth AfricaSouth AmericaSouth Central AsiaSouth Eastern AsiaSouthern EuropeSpainSri LankaSt. Vincent and the GrenadinesSudanSwedenSwitzerlandSyriaTaiwanThailandTrinidad and TobagoTurkeyUgandaUkraineUruguayUzbekistanVenezuelaVietnamWest IndiesWestern AfricaWestern AsiaWestern EuropeYemenZaireZimbabweAzores
Unemployment Among Women with Children Under 18 years
Income
Poverty
Unemployment
Labor Participation
Family Structure
Vehicle Availability
Education Level
Disability

Unemployment Among Women with Children Under 18 years Comparison

Immigrants from Lithuania

Cheyenne

Exceptional
Tragic
5.2%
UNEMPLOYMENT AMONG WOMEN WITH CHILDREN UNDER 18 YEARS
95.4/ 100
METRIC RATING
81st/ 347
METRIC RANK
7.8%
UNEMPLOYMENT AMONG WOMEN WITH CHILDREN UNDER 18 YEARS
0.0/ 100
METRIC RATING
334th/ 347
METRIC RANK

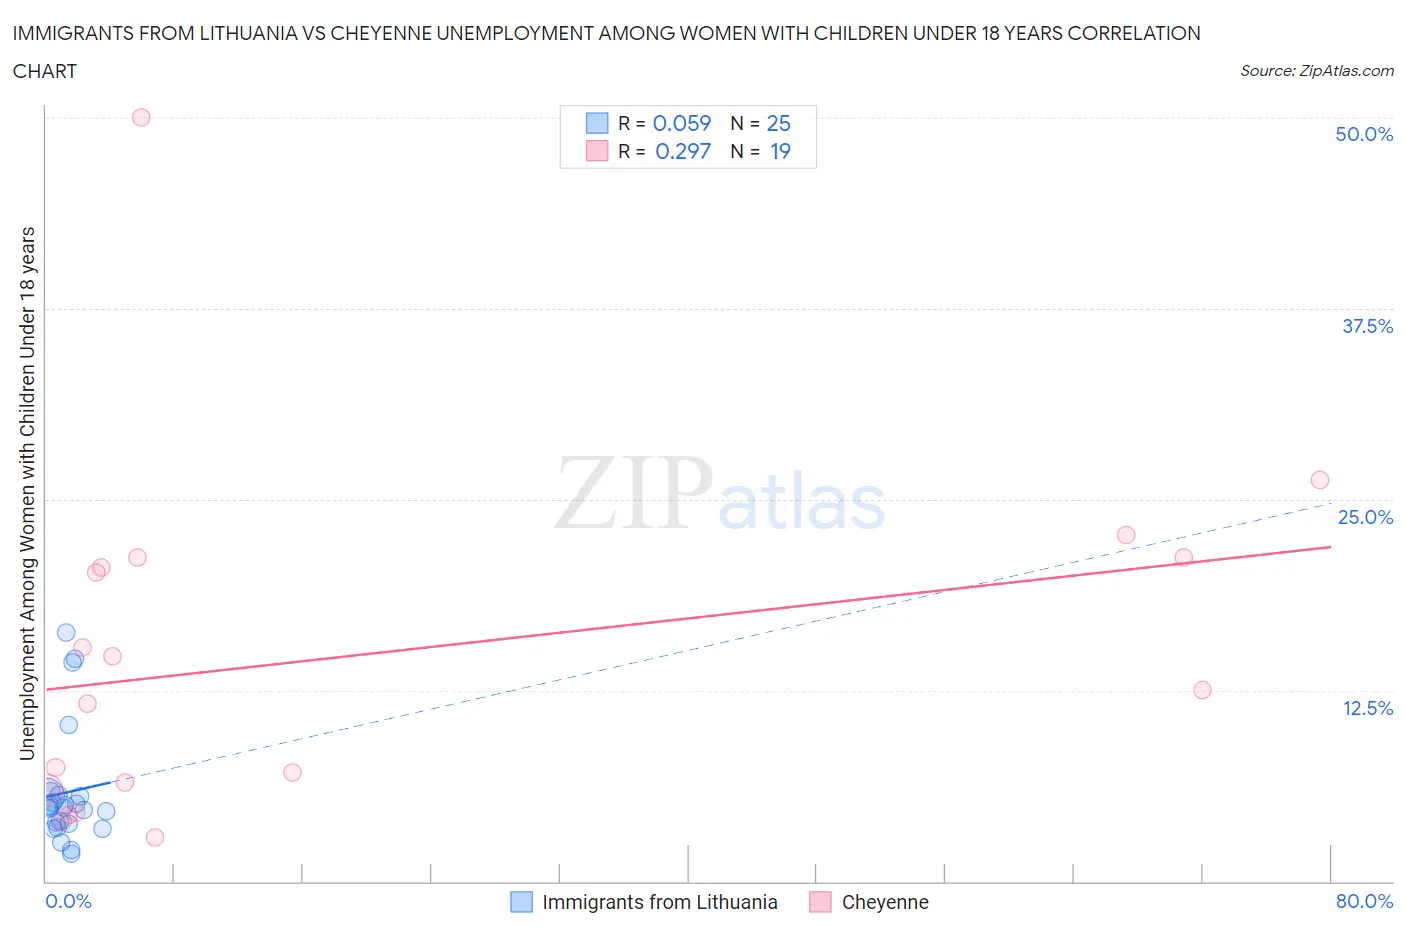
Immigrants from Lithuania vs Cheyenne Unemployment Among Women with Children Under 18 years Correlation Chart

The statistical analysis conducted on geographies consisting of 115,897,775 people shows a slight positive correlation between the proportion of Immigrants from Lithuania and unemployment rate among women with children under the age of 18 in the United States with a correlation coefficient (R) of 0.059 and weighted average of 5.2%. Similarly, the statistical analysis conducted on geographies consisting of 79,481,561 people shows a weak positive correlation between the proportion of Cheyenne and unemployment rate among women with children under the age of 18 in the United States with a correlation coefficient (R) of 0.297 and weighted average of 7.8%, a difference of 52.2%.
Immigrants from Lithuania vs Cheyenne Unemployment Among Women with Children Under 18 years

Unemployment Among Women with Children Under 18 years Correlation Summary

MeasurementImmigrants from LithuaniaCheyenne
Minimum1.8%2.9%
Maximum16.3%50.0%
Range14.5%47.1%
Mean5.8%14.7%
Median4.8%12.5%
Interquartile 25% (IQ1)3.6%6.0%
Interquartile 75% (IQ3)5.6%21.2%
Interquartile Range (IQR)2.0%15.2%
Standard Deviation (Sample)3.8%11.4%
Standard Deviation (Population)3.8%11.1%

Similar Demographics by Unemployment Among Women with Children Under 18 years

Demographics Similar to Immigrants from Lithuania by Unemployment Among Women with Children Under 18 years

In terms of unemployment among women with children under 18 years, the demographic groups most similar to Immigrants from Lithuania are Bolivian (5.1%, a difference of 0.040%), Romanian (5.2%, a difference of 0.050%), Immigrants from Croatia (5.1%, a difference of 0.090%), Assyrian/Chaldean/Syriac (5.1%, a difference of 0.11%), and Zimbabwean (5.1%, a difference of 0.13%).
DemographicsRating | RankUnemployment Among Women with Children Under 18 years
Immigrants | Northern Europe
95.9
/100
|
#74
Exceptional
5.1%
Immigrants | Asia
95.8
/100
|
#75
Exceptional
5.1%
Puget Sound Salish
95.8
/100
|
#76
Exceptional
5.1%
Zimbabweans
95.7
/100
|
#77
Exceptional
5.1%
Assyrians/Chaldeans/Syriacs
95.7
/100
|
#78
Exceptional
5.1%
Immigrants | Croatia
95.6
/100
|
#79
Exceptional
5.1%
Bolivians
95.5
/100
|
#80
Exceptional
5.1%
Immigrants | Lithuania
95.4
/100
|
#81
Exceptional
5.2%
Romanians
95.3
/100
|
#82
Exceptional
5.2%
Maltese
95.1
/100
|
#83
Exceptional
5.2%
Australians
95.1
/100
|
#84
Exceptional
5.2%
Paraguayans
94.8
/100
|
#85
Exceptional
5.2%
Immigrants | Indonesia
94.8
/100
|
#86
Exceptional
5.2%
Laotians
94.7
/100
|
#87
Exceptional
5.2%
Immigrants | Scotland
94.5
/100
|
#88
Exceptional
5.2%

Demographics Similar to Cheyenne by Unemployment Among Women with Children Under 18 years

In terms of unemployment among women with children under 18 years, the demographic groups most similar to Cheyenne are Apache (7.9%, a difference of 0.98%), Sioux (7.9%, a difference of 1.3%), Yakama (8.1%, a difference of 2.7%), Immigrants from Yemen (8.2%, a difference of 4.4%), and Immigrants from Dominican Republic (7.5%, a difference of 4.6%).
DemographicsRating | RankUnemployment Among Women with Children Under 18 years
Lumbee
0.0
/100
|
#327
Tragic
7.1%
Natives/Alaskans
0.0
/100
|
#328
Tragic
7.2%
Blacks/African Americans
0.0
/100
|
#329
Tragic
7.3%
Colville
0.0
/100
|
#330
Tragic
7.4%
Hopi
0.0
/100
|
#331
Tragic
7.4%
Dominicans
0.0
/100
|
#332
Tragic
7.5%
Immigrants | Dominican Republic
0.0
/100
|
#333
Tragic
7.5%
Cheyenne
0.0
/100
|
#334
Tragic
7.8%
Apache
0.0
/100
|
#335
Tragic
7.9%
Sioux
0.0
/100
|
#336
Tragic
7.9%
Yakama
0.0
/100
|
#337
Tragic
8.1%
Immigrants | Yemen
0.0
/100
|
#338
Tragic
8.2%
Navajo
0.0
/100
|
#339
Tragic
8.2%
Crow
0.0
/100
|
#340
Tragic
8.2%
Tohono O'odham
0.0
/100
|
#341
Tragic
8.9%