Houma vs Immigrants from Lebanon Unemployment Among Women with Children Under 6 years
COMPARE
Houma
Immigrants from Lebanon
Unemployment Among Women with Children Under 6 years
Unemployment Among Women with Children Under 6 years Comparison
Houma
Immigrants from Lebanon
9.4%
UNEMPLOYMENT AMONG WOMEN WITH CHILDREN UNDER 6 YEARS
0.0/ 100
METRIC RATING
316th/ 347
METRIC RANK
7.9%
UNEMPLOYMENT AMONG WOMEN WITH CHILDREN UNDER 6 YEARS
11.1/ 100
METRIC RATING
216th/ 347
METRIC RANK
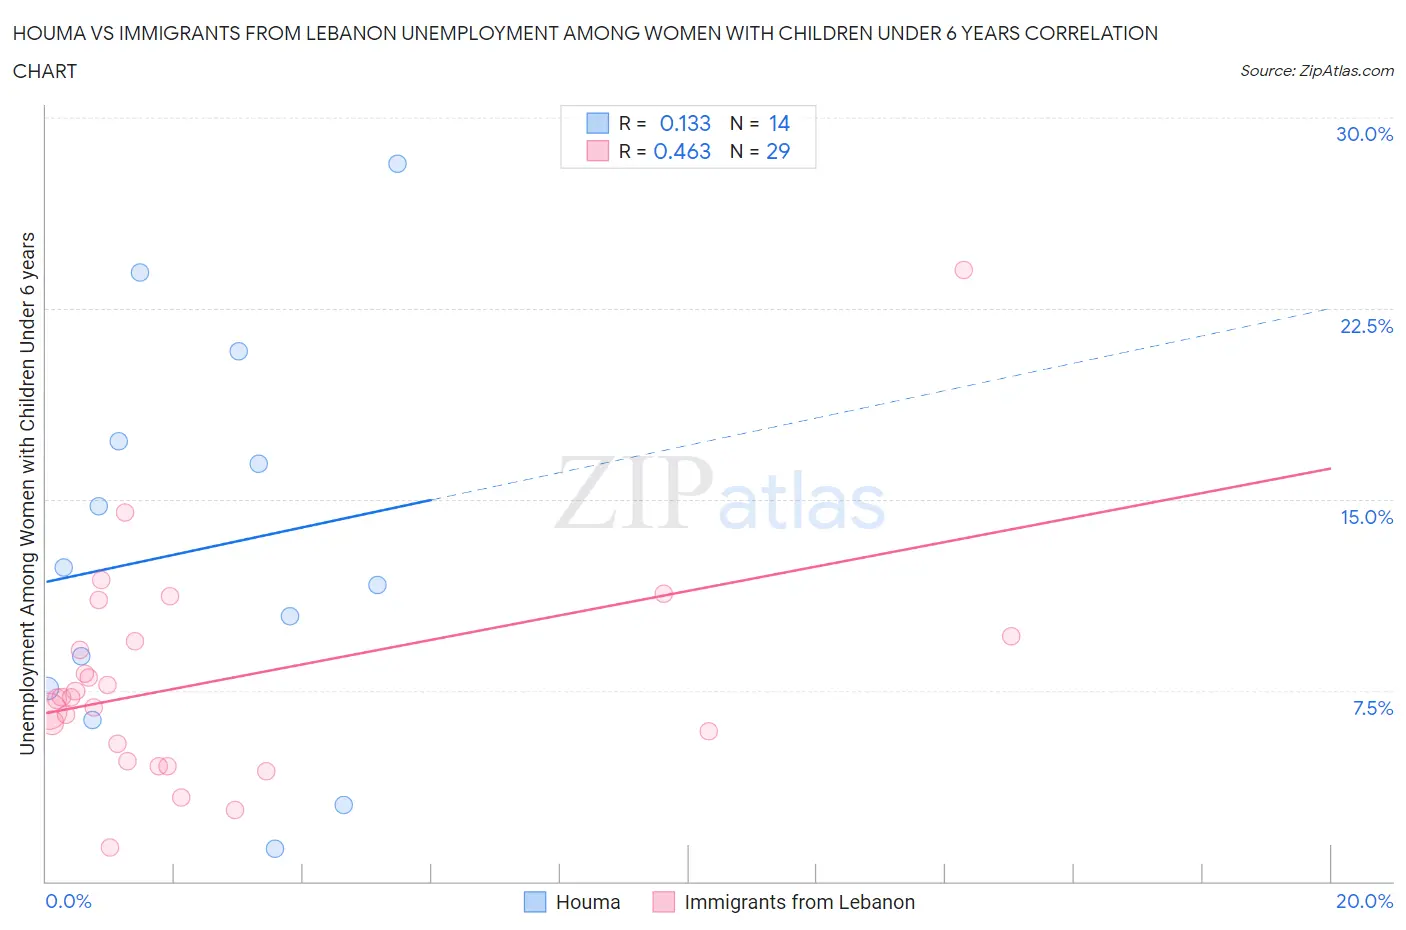
Houma vs Immigrants from Lebanon Unemployment Among Women with Children Under 6 years Correlation Chart
The statistical analysis conducted on geographies consisting of 34,510,951 people shows a poor positive correlation between the proportion of Houma and unemployment rate among women with children under the age of 6 in the United States with a correlation coefficient (R) of 0.133 and weighted average of 9.4%. Similarly, the statistical analysis conducted on geographies consisting of 182,697,940 people shows a moderate positive correlation between the proportion of Immigrants from Lebanon and unemployment rate among women with children under the age of 6 in the United States with a correlation coefficient (R) of 0.463 and weighted average of 7.9%, a difference of 18.9%.
Unemployment Among Women with Children Under 6 years Correlation Summary
| Measurement | Houma | Immigrants from Lebanon |
| Minimum | 1.3% | 1.3% |
| Maximum | 28.2% | 24.0% |
| Range | 26.9% | 22.7% |
| Mean | 13.1% | 7.9% |
| Median | 12.0% | 7.2% |
| Interquartile 25% (IQ1) | 7.6% | 5.1% |
| Interquartile 75% (IQ3) | 17.3% | 9.5% |
| Interquartile Range (IQR) | 9.7% | 4.4% |
| Standard Deviation (Sample) | 7.7% | 4.3% |
| Standard Deviation (Population) | 7.5% | 4.2% |
Similar Demographics by Unemployment Among Women with Children Under 6 years
Demographics Similar to Houma by Unemployment Among Women with Children Under 6 years
In terms of unemployment among women with children under 6 years, the demographic groups most similar to Houma are Cherokee (9.3%, a difference of 0.78%), Dutch West Indian (9.5%, a difference of 0.79%), Osage (9.5%, a difference of 0.85%), Fijian (9.3%, a difference of 1.6%), and American (9.3%, a difference of 1.6%).
| Demographics | Rating | Rank | Unemployment Among Women with Children Under 6 years |
| Africans | 0.0 /100 | #309 | Tragic 9.2% |
| Cajuns | 0.0 /100 | #310 | Tragic 9.2% |
| French American Indians | 0.0 /100 | #311 | Tragic 9.2% |
| Immigrants | Azores | 0.0 /100 | #312 | Tragic 9.2% |
| Americans | 0.0 /100 | #313 | Tragic 9.3% |
| Fijians | 0.0 /100 | #314 | Tragic 9.3% |
| Cherokee | 0.0 /100 | #315 | Tragic 9.3% |
| Houma | 0.0 /100 | #316 | Tragic 9.4% |
| Dutch West Indians | 0.0 /100 | #317 | Tragic 9.5% |
| Osage | 0.0 /100 | #318 | Tragic 9.5% |
| Marshallese | 0.0 /100 | #319 | Tragic 9.6% |
| Potawatomi | 0.0 /100 | #320 | Tragic 9.6% |
| Central American Indians | 0.0 /100 | #321 | Tragic 9.6% |
| Alaska Natives | 0.0 /100 | #322 | Tragic 9.6% |
| Immigrants | Bahamas | 0.0 /100 | #323 | Tragic 9.6% |
Demographics Similar to Immigrants from Lebanon by Unemployment Among Women with Children Under 6 years
In terms of unemployment among women with children under 6 years, the demographic groups most similar to Immigrants from Lebanon are Ecuadorian (7.9%, a difference of 0.020%), Spanish (7.9%, a difference of 0.030%), Scottish (7.9%, a difference of 0.050%), Immigrants from Nigeria (7.9%, a difference of 0.12%), and Swiss (7.9%, a difference of 0.19%).
| Demographics | Rating | Rank | Unemployment Among Women with Children Under 6 years |
| Costa Ricans | 17.6 /100 | #209 | Poor 7.8% |
| Poles | 16.0 /100 | #210 | Poor 7.9% |
| Immigrants | Ecuador | 14.9 /100 | #211 | Poor 7.9% |
| Swiss | 12.3 /100 | #212 | Poor 7.9% |
| Scottish | 11.4 /100 | #213 | Poor 7.9% |
| Spanish | 11.3 /100 | #214 | Poor 7.9% |
| Ecuadorians | 11.2 /100 | #215 | Poor 7.9% |
| Immigrants | Lebanon | 11.1 /100 | #216 | Poor 7.9% |
| Immigrants | Nigeria | 10.3 /100 | #217 | Poor 7.9% |
| Moroccans | 9.7 /100 | #218 | Tragic 7.9% |
| Arabs | 9.4 /100 | #219 | Tragic 7.9% |
| South American Indians | 9.3 /100 | #220 | Tragic 7.9% |
| Immigrants | Germany | 8.5 /100 | #221 | Tragic 7.9% |
| Samoans | 8.4 /100 | #222 | Tragic 7.9% |
| Carpatho Rusyns | 7.8 /100 | #223 | Tragic 8.0% |