Immigrants from Denmark vs Venezuelan Male Unemployment
COMPARE
Immigrants from Denmark
Venezuelan
Male Unemployment
Male Unemployment Comparison
Immigrants from Denmark
Venezuelans
5.1%
MALE UNEMPLOYMENT
89.4/ 100
METRIC RATING
116th/ 347
METRIC RANK
4.5%
MALE UNEMPLOYMENT
100.0/ 100
METRIC RATING
6th/ 347
METRIC RANK
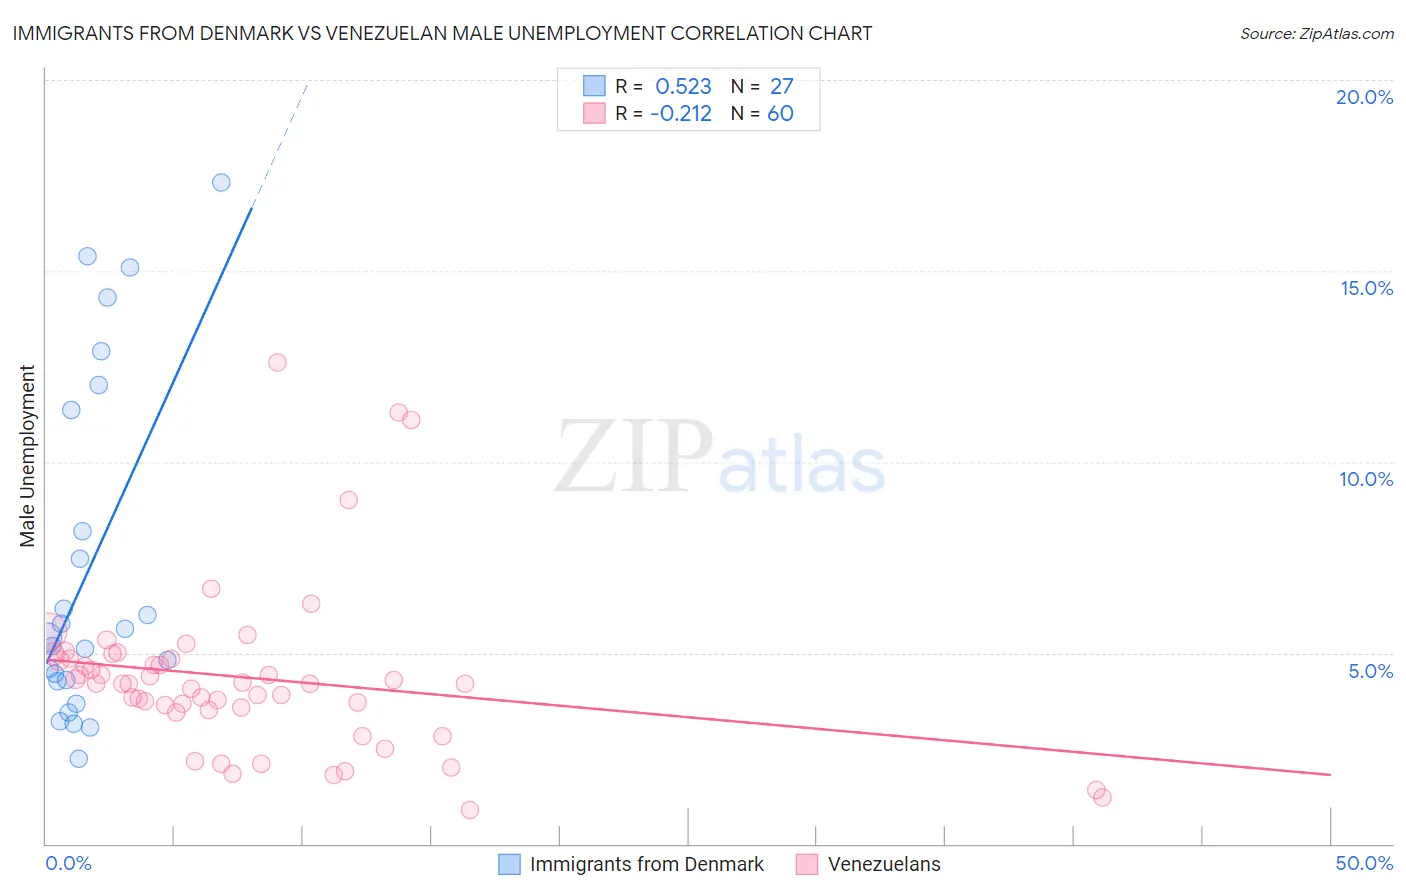
Immigrants from Denmark vs Venezuelan Male Unemployment Correlation Chart
The statistical analysis conducted on geographies consisting of 136,170,297 people shows a substantial positive correlation between the proportion of Immigrants from Denmark and unemployment rate among males in the United States with a correlation coefficient (R) of 0.523 and weighted average of 5.1%. Similarly, the statistical analysis conducted on geographies consisting of 305,681,073 people shows a weak negative correlation between the proportion of Venezuelans and unemployment rate among males in the United States with a correlation coefficient (R) of -0.212 and weighted average of 4.5%, a difference of 13.6%.
Male Unemployment Correlation Summary
| Measurement | Immigrants from Denmark | Venezuelan |
| Minimum | 2.2% | 0.90% |
| Maximum | 17.3% | 12.6% |
| Range | 15.1% | 11.7% |
| Mean | 7.2% | 4.3% |
| Median | 5.4% | 4.2% |
| Interquartile 25% (IQ1) | 4.3% | 3.5% |
| Interquartile 75% (IQ3) | 11.4% | 4.8% |
| Interquartile Range (IQR) | 7.1% | 1.3% |
| Standard Deviation (Sample) | 4.4% | 2.2% |
| Standard Deviation (Population) | 4.4% | 2.2% |
Similar Demographics by Male Unemployment
Demographics Similar to Immigrants from Denmark by Male Unemployment
In terms of male unemployment, the demographic groups most similar to Immigrants from Denmark are Immigrants from Asia (5.1%, a difference of 0.040%), Estonian (5.1%, a difference of 0.050%), Romanian (5.1%, a difference of 0.070%), Cypriot (5.1%, a difference of 0.080%), and French Canadian (5.1%, a difference of 0.12%).
| Demographics | Rating | Rank | Male Unemployment |
| Immigrants | Pakistan | 90.9 /100 | #109 | Exceptional 5.1% |
| Immigrants | England | 90.8 /100 | #110 | Exceptional 5.1% |
| Immigrants | Eastern Asia | 90.8 /100 | #111 | Exceptional 5.1% |
| Immigrants | Moldova | 90.3 /100 | #112 | Exceptional 5.1% |
| Immigrants | Austria | 90.3 /100 | #113 | Exceptional 5.1% |
| Romanians | 89.8 /100 | #114 | Excellent 5.1% |
| Immigrants | Asia | 89.6 /100 | #115 | Excellent 5.1% |
| Immigrants | Denmark | 89.4 /100 | #116 | Excellent 5.1% |
| Estonians | 89.0 /100 | #117 | Excellent 5.1% |
| Cypriots | 88.8 /100 | #118 | Excellent 5.1% |
| French Canadians | 88.6 /100 | #119 | Excellent 5.1% |
| Ukrainians | 88.4 /100 | #120 | Excellent 5.1% |
| Mongolians | 88.4 /100 | #121 | Excellent 5.1% |
| Nicaraguans | 88.2 /100 | #122 | Excellent 5.1% |
| Palestinians | 87.7 /100 | #123 | Excellent 5.1% |
Demographics Similar to Venezuelans by Male Unemployment
In terms of male unemployment, the demographic groups most similar to Venezuelans are Czech (4.5%, a difference of 0.20%), Danish (4.5%, a difference of 0.45%), Luxembourger (4.5%, a difference of 0.46%), Immigrants from Venezuela (4.4%, a difference of 1.5%), and Thai (4.6%, a difference of 1.7%).
| Demographics | Rating | Rank | Male Unemployment |
| Immigrants | India | 100.0 /100 | #1 | Exceptional 4.4% |
| Immigrants | Cuba | 100.0 /100 | #2 | Exceptional 4.4% |
| Norwegians | 100.0 /100 | #3 | Exceptional 4.4% |
| Immigrants | Venezuela | 100.0 /100 | #4 | Exceptional 4.4% |
| Danes | 100.0 /100 | #5 | Exceptional 4.5% |
| Venezuelans | 100.0 /100 | #6 | Exceptional 4.5% |
| Czechs | 100.0 /100 | #7 | Exceptional 4.5% |
| Luxembourgers | 100.0 /100 | #8 | Exceptional 4.5% |
| Thais | 100.0 /100 | #9 | Exceptional 4.6% |
| Cubans | 100.0 /100 | #10 | Exceptional 4.6% |
| Swedes | 100.0 /100 | #11 | Exceptional 4.6% |
| Immigrants | Bolivia | 100.0 /100 | #12 | Exceptional 4.7% |
| Bolivians | 100.0 /100 | #13 | Exceptional 4.7% |
| Germans | 100.0 /100 | #14 | Exceptional 4.7% |
| Scandinavians | 100.0 /100 | #15 | Exceptional 4.7% |