Immigrants from Czechoslovakia vs Immigrants from China Unemployment Among Ages 65 to 74 years
COMPARE
Immigrants from Czechoslovakia
Immigrants from China
Unemployment Among Ages 65 to 74 years
Unemployment Among Ages 65 to 74 years Comparison
Immigrants from Czechoslovakia
Immigrants from China
5.3%
UNEMPLOYMENT AMONG AGES 65 TO 74 YEARS
66.3/ 100
METRIC RATING
159th/ 347
METRIC RANK
5.4%
UNEMPLOYMENT AMONG AGES 65 TO 74 YEARS
24.2/ 100
METRIC RATING
195th/ 347
METRIC RANK
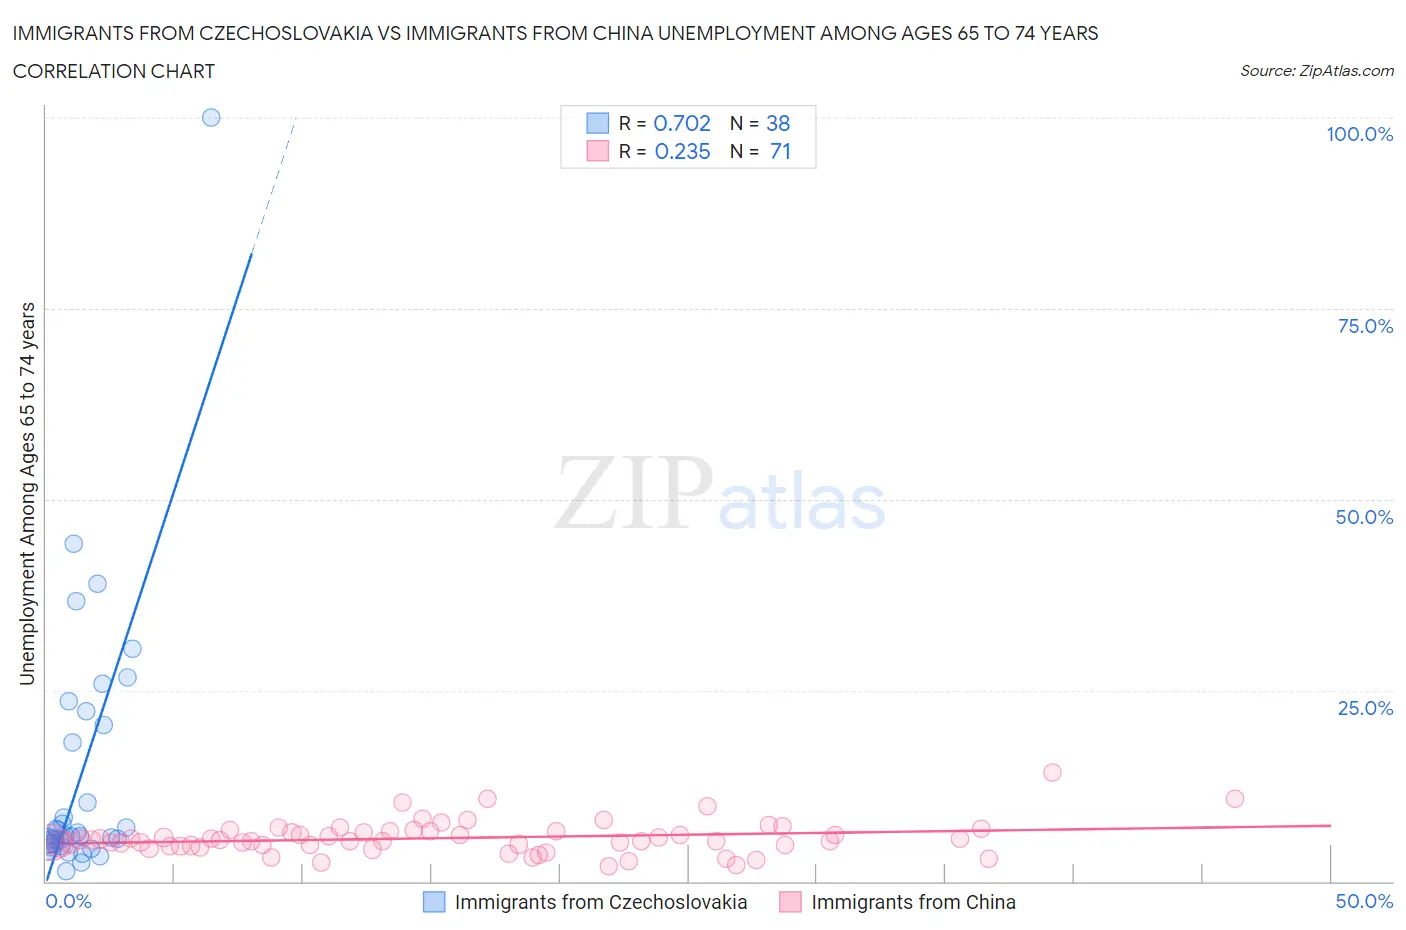
Immigrants from Czechoslovakia vs Immigrants from China Unemployment Among Ages 65 to 74 years Correlation Chart
The statistical analysis conducted on geographies consisting of 183,966,950 people shows a strong positive correlation between the proportion of Immigrants from Czechoslovakia and unemployment rate among population between the ages 65 and 74 in the United States with a correlation coefficient (R) of 0.702 and weighted average of 5.3%. Similarly, the statistical analysis conducted on geographies consisting of 393,737,686 people shows a weak positive correlation between the proportion of Immigrants from China and unemployment rate among population between the ages 65 and 74 in the United States with a correlation coefficient (R) of 0.235 and weighted average of 5.4%, a difference of 1.5%.
Unemployment Among Ages 65 to 74 years Correlation Summary
| Measurement | Immigrants from Czechoslovakia | Immigrants from China |
| Minimum | 1.2% | 1.9% |
| Maximum | 100.0% | 14.3% |
| Range | 98.8% | 12.4% |
| Mean | 14.0% | 5.7% |
| Median | 6.0% | 5.3% |
| Interquartile 25% (IQ1) | 4.9% | 4.7% |
| Interquartile 75% (IQ3) | 20.5% | 6.5% |
| Interquartile Range (IQR) | 15.6% | 1.9% |
| Standard Deviation (Sample) | 18.2% | 2.1% |
| Standard Deviation (Population) | 18.0% | 2.1% |
Similar Demographics by Unemployment Among Ages 65 to 74 years
Demographics Similar to Immigrants from Czechoslovakia by Unemployment Among Ages 65 to 74 years
In terms of unemployment among ages 65 to 74 years, the demographic groups most similar to Immigrants from Czechoslovakia are Bangladeshi (5.3%, a difference of 0.020%), Immigrants from Italy (5.3%, a difference of 0.10%), Immigrants from Eastern Asia (5.3%, a difference of 0.14%), Mongolian (5.3%, a difference of 0.15%), and Immigrants from France (5.3%, a difference of 0.18%).
| Demographics | Rating | Rank | Unemployment Among Ages 65 to 74 years |
| Spanish | 72.6 /100 | #152 | Good 5.3% |
| Immigrants | Cabo Verde | 72.5 /100 | #153 | Good 5.3% |
| Poles | 72.4 /100 | #154 | Good 5.3% |
| Immigrants | Cameroon | 72.1 /100 | #155 | Good 5.3% |
| Dutch | 72.0 /100 | #156 | Good 5.3% |
| Immigrants | Eastern Europe | 71.5 /100 | #157 | Good 5.3% |
| Immigrants | France | 71.0 /100 | #158 | Good 5.3% |
| Immigrants | Czechoslovakia | 66.3 /100 | #159 | Good 5.3% |
| Bangladeshis | 65.8 /100 | #160 | Good 5.3% |
| Immigrants | Italy | 63.7 /100 | #161 | Good 5.3% |
| Immigrants | Eastern Asia | 62.5 /100 | #162 | Good 5.3% |
| Mongolians | 62.3 /100 | #163 | Good 5.3% |
| Immigrants | Philippines | 61.2 /100 | #164 | Good 5.3% |
| Immigrants | Bosnia and Herzegovina | 60.2 /100 | #165 | Good 5.3% |
| Slovaks | 60.0 /100 | #166 | Good 5.3% |
Demographics Similar to Immigrants from China by Unemployment Among Ages 65 to 74 years
In terms of unemployment among ages 65 to 74 years, the demographic groups most similar to Immigrants from China are Immigrants from Denmark (5.4%, a difference of 0.020%), Cherokee (5.4%, a difference of 0.070%), Immigrants from Egypt (5.4%, a difference of 0.10%), Maltese (5.4%, a difference of 0.10%), and Basque (5.4%, a difference of 0.11%).
| Demographics | Rating | Rank | Unemployment Among Ages 65 to 74 years |
| Immigrants | Europe | 28.8 /100 | #188 | Fair 5.4% |
| Immigrants | Africa | 28.3 /100 | #189 | Fair 5.4% |
| Basques | 26.6 /100 | #190 | Fair 5.4% |
| Immigrants | Egypt | 26.5 /100 | #191 | Fair 5.4% |
| Maltese | 26.4 /100 | #192 | Fair 5.4% |
| Cherokee | 25.8 /100 | #193 | Fair 5.4% |
| Immigrants | Denmark | 24.7 /100 | #194 | Fair 5.4% |
| Immigrants | China | 24.2 /100 | #195 | Fair 5.4% |
| Costa Ricans | 21.1 /100 | #196 | Fair 5.4% |
| Colville | 20.4 /100 | #197 | Fair 5.4% |
| Albanians | 17.8 /100 | #198 | Poor 5.4% |
| Immigrants | Belgium | 16.2 /100 | #199 | Poor 5.4% |
| Immigrants | Pakistan | 15.2 /100 | #200 | Poor 5.4% |
| Immigrants | Western Asia | 14.9 /100 | #201 | Poor 5.4% |
| Sub-Saharan Africans | 14.4 /100 | #202 | Poor 5.4% |