Immigrants from Congo vs Yuman Unemployment Among Ages 60 to 64 years
COMPARE
Immigrants from Congo
Yuman
Unemployment Among Ages 60 to 64 years
Unemployment Among Ages 60 to 64 years Comparison
Immigrants from Congo
Yuman
4.1%
UNEMPLOYMENT AMONG AGES 60 TO 64 YEARS
100.0/ 100
METRIC RATING
6th/ 347
METRIC RANK
6.8%
UNEMPLOYMENT AMONG AGES 60 TO 64 YEARS
0.0/ 100
METRIC RATING
341st/ 347
METRIC RANK
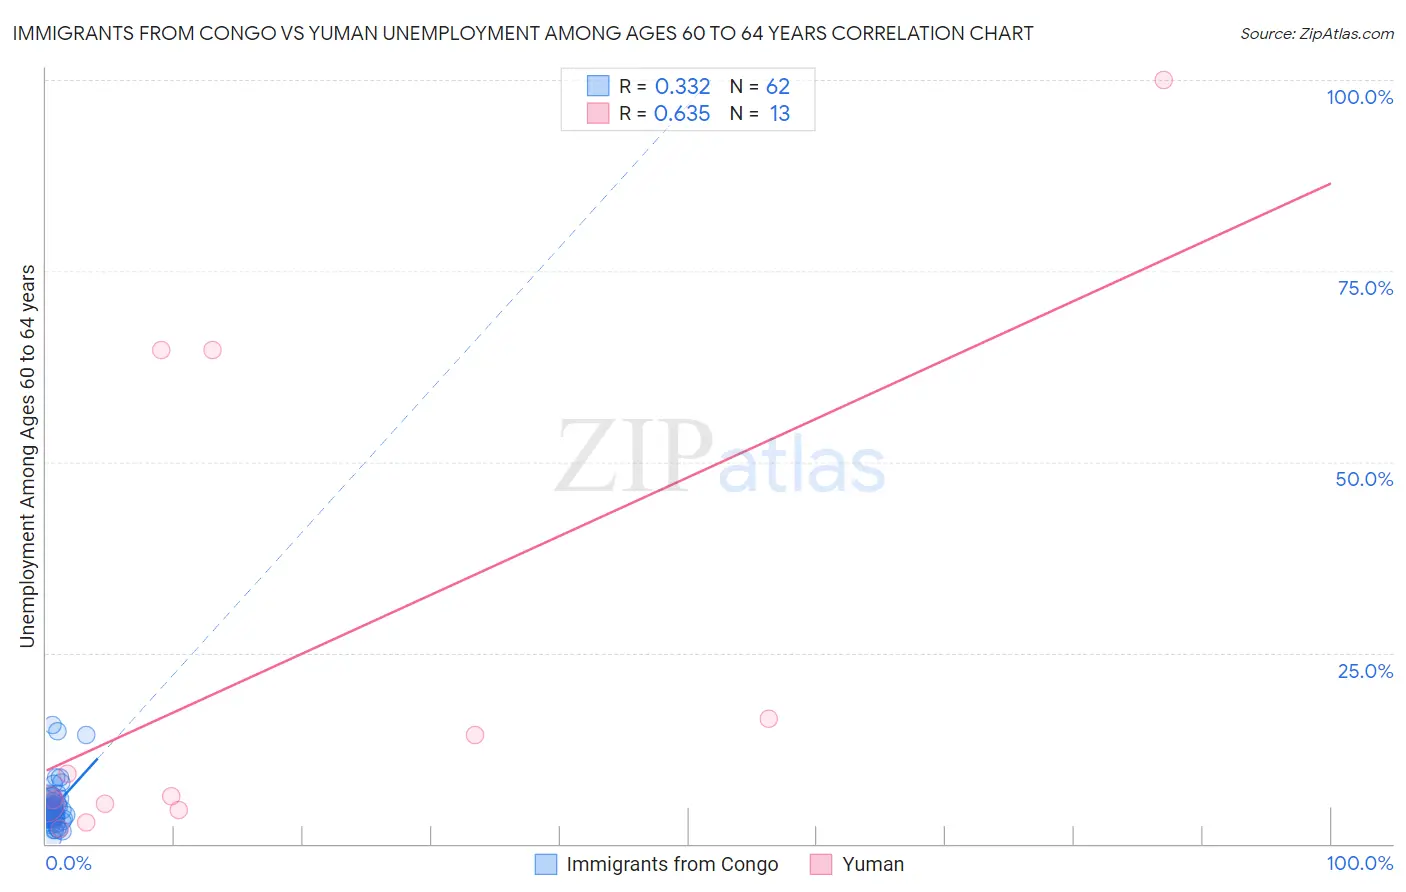
Immigrants from Congo vs Yuman Unemployment Among Ages 60 to 64 years Correlation Chart
The statistical analysis conducted on geographies consisting of 89,429,972 people shows a mild positive correlation between the proportion of Immigrants from Congo and unemployment rate among population between the ages 60 and 64 in the United States with a correlation coefficient (R) of 0.332 and weighted average of 4.1%. Similarly, the statistical analysis conducted on geographies consisting of 39,921,658 people shows a significant positive correlation between the proportion of Yuman and unemployment rate among population between the ages 60 and 64 in the United States with a correlation coefficient (R) of 0.635 and weighted average of 6.8%, a difference of 64.2%.
Unemployment Among Ages 60 to 64 years Correlation Summary
| Measurement | Immigrants from Congo | Yuman |
| Minimum | 0.70% | 2.0% |
| Maximum | 15.5% | 100.0% |
| Range | 14.8% | 98.0% |
| Mean | 4.8% | 23.1% |
| Median | 4.2% | 6.2% |
| Interquartile 25% (IQ1) | 3.4% | 4.8% |
| Interquartile 75% (IQ3) | 5.2% | 40.5% |
| Interquartile Range (IQR) | 1.8% | 35.8% |
| Standard Deviation (Sample) | 2.8% | 31.8% |
| Standard Deviation (Population) | 2.8% | 30.5% |
Similar Demographics by Unemployment Among Ages 60 to 64 years
Demographics Similar to Immigrants from Congo by Unemployment Among Ages 60 to 64 years
In terms of unemployment among ages 60 to 64 years, the demographic groups most similar to Immigrants from Congo are Lumbee (4.2%, a difference of 0.91%), Immigrants from Micronesia (4.2%, a difference of 2.1%), Indonesian (4.2%, a difference of 2.6%), Immigrants from the Azores (4.0%, a difference of 2.7%), and Hmong (4.0%, a difference of 2.7%).
| Demographics | Rating | Rank | Unemployment Among Ages 60 to 64 years |
| Marshallese | 100.0 /100 | #1 | Exceptional 3.7% |
| Fijians | 100.0 /100 | #2 | Exceptional 3.9% |
| Chinese | 100.0 /100 | #3 | Exceptional 4.0% |
| Hmong | 100.0 /100 | #4 | Exceptional 4.0% |
| Immigrants | Azores | 100.0 /100 | #5 | Exceptional 4.0% |
| Immigrants | Congo | 100.0 /100 | #6 | Exceptional 4.1% |
| Lumbee | 100.0 /100 | #7 | Exceptional 4.2% |
| Immigrants | Micronesia | 100.0 /100 | #8 | Exceptional 4.2% |
| Indonesians | 100.0 /100 | #9 | Exceptional 4.2% |
| Immigrants | Bosnia and Herzegovina | 100.0 /100 | #10 | Exceptional 4.2% |
| Luxembourgers | 100.0 /100 | #11 | Exceptional 4.3% |
| Immigrants | Cuba | 100.0 /100 | #12 | Exceptional 4.3% |
| Chickasaw | 100.0 /100 | #13 | Exceptional 4.3% |
| Norwegians | 100.0 /100 | #14 | Exceptional 4.3% |
| Sudanese | 100.0 /100 | #15 | Exceptional 4.3% |
Demographics Similar to Yuman by Unemployment Among Ages 60 to 64 years
In terms of unemployment among ages 60 to 64 years, the demographic groups most similar to Yuman are Aleut (6.8%, a difference of 0.010%), Pueblo (6.7%, a difference of 0.53%), Immigrants from Yemen (6.8%, a difference of 0.73%), Tlingit-Haida (6.4%, a difference of 6.1%), and Arapaho (6.3%, a difference of 7.6%).
| Demographics | Rating | Rank | Unemployment Among Ages 60 to 64 years |
| Immigrants | Dominican Republic | 0.0 /100 | #333 | Tragic 6.0% |
| Puerto Ricans | 0.0 /100 | #334 | Tragic 6.1% |
| Vietnamese | 0.0 /100 | #335 | Tragic 6.1% |
| Kiowa | 0.0 /100 | #336 | Tragic 6.2% |
| Navajo | 0.0 /100 | #337 | Tragic 6.3% |
| Arapaho | 0.0 /100 | #338 | Tragic 6.3% |
| Tlingit-Haida | 0.0 /100 | #339 | Tragic 6.4% |
| Pueblo | 0.0 /100 | #340 | Tragic 6.7% |
| Yuman | 0.0 /100 | #341 | Tragic 6.8% |
| Aleuts | 0.0 /100 | #342 | Tragic 6.8% |
| Immigrants | Yemen | 0.0 /100 | #343 | Tragic 6.8% |
| Alaska Natives | 0.0 /100 | #344 | Tragic 7.6% |
| Alaskan Athabascans | 0.0 /100 | #345 | Tragic 8.4% |
| Inupiat | 0.0 /100 | #346 | Tragic 9.6% |
| Yup'ik | 0.0 /100 | #347 | Tragic 11.9% |