Immigrants from Trinidad and Tobago vs Asian Unemployment Among Youth under 25 years
COMPARE
Immigrants from Trinidad and Tobago
Asian
Unemployment Among Youth under 25 years
Unemployment Among Youth under 25 years Comparison
Immigrants from Trinidad and Tobago
Asians
14.6%
UNEMPLOYMENT AMONG YOUTH UNDER 25 YEARS
0.0/ 100
METRIC RATING
323rd/ 347
METRIC RANK
11.4%
UNEMPLOYMENT AMONG YOUTH UNDER 25 YEARS
79.7/ 100
METRIC RATING
137th/ 347
METRIC RANK
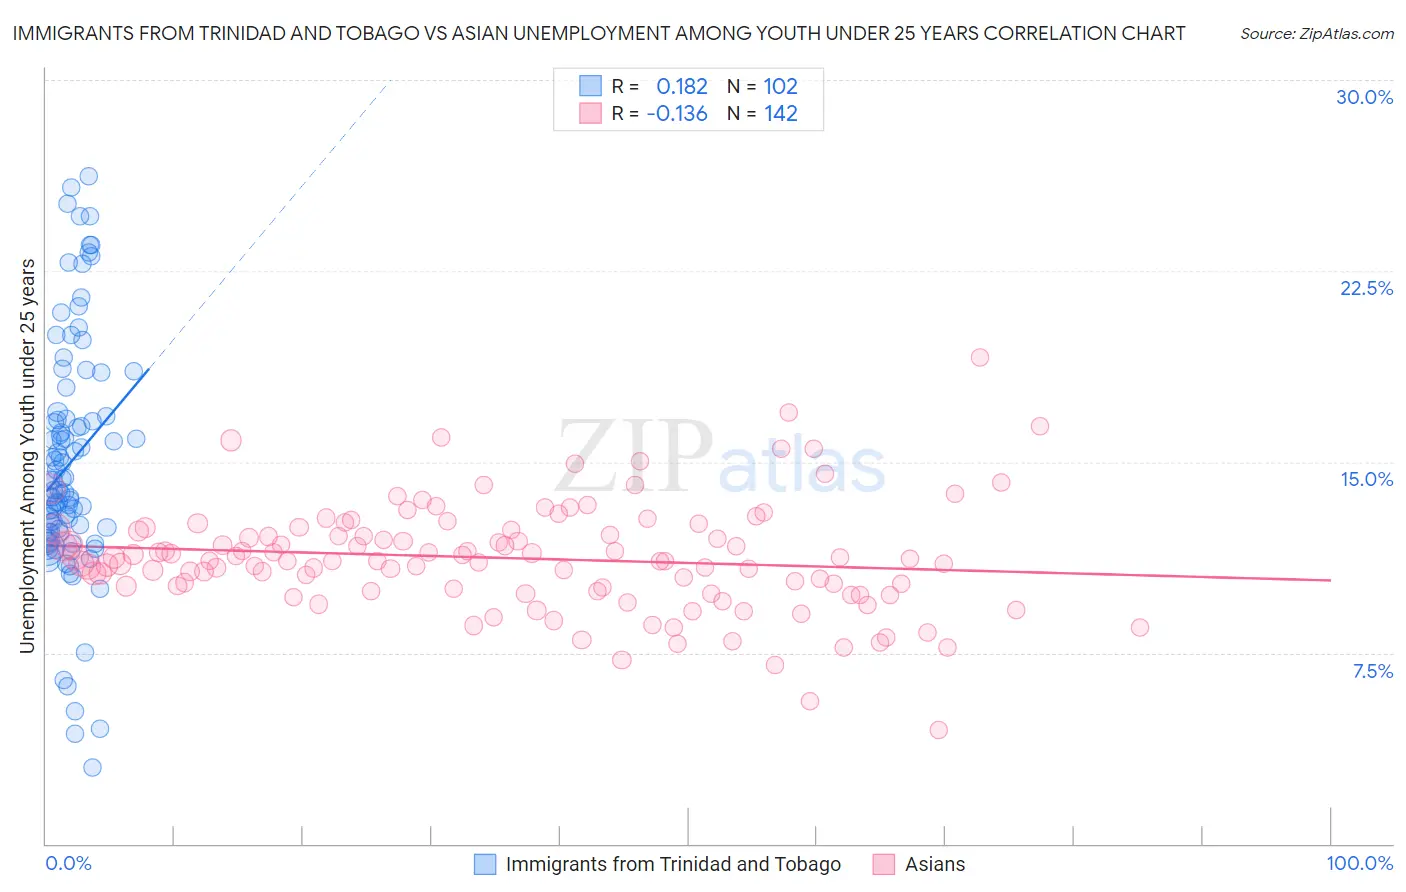
Immigrants from Trinidad and Tobago vs Asian Unemployment Among Youth under 25 years Correlation Chart
The statistical analysis conducted on geographies consisting of 222,365,515 people shows a poor positive correlation between the proportion of Immigrants from Trinidad and Tobago and unemployment rate among youth under the age of 25 in the United States with a correlation coefficient (R) of 0.182 and weighted average of 14.6%. Similarly, the statistical analysis conducted on geographies consisting of 533,644,399 people shows a poor negative correlation between the proportion of Asians and unemployment rate among youth under the age of 25 in the United States with a correlation coefficient (R) of -0.136 and weighted average of 11.4%, a difference of 27.9%.
Unemployment Among Youth under 25 years Correlation Summary
| Measurement | Immigrants from Trinidad and Tobago | Asian |
| Minimum | 3.0% | 4.5% |
| Maximum | 26.2% | 19.1% |
| Range | 23.2% | 14.6% |
| Mean | 15.0% | 11.2% |
| Median | 14.1% | 11.1% |
| Interquartile 25% (IQ1) | 12.2% | 10.0% |
| Interquartile 75% (IQ3) | 16.8% | 12.3% |
| Interquartile Range (IQR) | 4.6% | 2.3% |
| Standard Deviation (Sample) | 4.7% | 2.1% |
| Standard Deviation (Population) | 4.7% | 2.1% |
Similar Demographics by Unemployment Among Youth under 25 years
Demographics Similar to Immigrants from Trinidad and Tobago by Unemployment Among Youth under 25 years
In terms of unemployment among youth under 25 years, the demographic groups most similar to Immigrants from Trinidad and Tobago are Trinidadian and Tobagonian (14.6%, a difference of 0.090%), Cheyenne (14.6%, a difference of 0.16%), Barbadian (14.6%, a difference of 0.32%), West Indian (14.6%, a difference of 0.36%), and Immigrants from Dominica (14.6%, a difference of 0.40%).
| Demographics | Rating | Rank | Unemployment Among Youth under 25 years |
| Natives/Alaskans | 0.0 /100 | #316 | Tragic 14.5% |
| Blacks/African Americans | 0.0 /100 | #317 | Tragic 14.5% |
| Immigrants | Dominica | 0.0 /100 | #318 | Tragic 14.6% |
| West Indians | 0.0 /100 | #319 | Tragic 14.6% |
| Barbadians | 0.0 /100 | #320 | Tragic 14.6% |
| Cheyenne | 0.0 /100 | #321 | Tragic 14.6% |
| Trinidadians and Tobagonians | 0.0 /100 | #322 | Tragic 14.6% |
| Immigrants | Trinidad and Tobago | 0.0 /100 | #323 | Tragic 14.6% |
| Immigrants | Jamaica | 0.0 /100 | #324 | Tragic 14.8% |
| Alaska Natives | 0.0 /100 | #325 | Tragic 14.9% |
| Immigrants | Barbados | 0.0 /100 | #326 | Tragic 15.2% |
| British West Indians | 0.0 /100 | #327 | Tragic 15.5% |
| Immigrants | Dominican Republic | 0.0 /100 | #328 | Tragic 15.6% |
| Immigrants | Yemen | 0.0 /100 | #329 | Tragic 15.6% |
| Yakama | 0.0 /100 | #330 | Tragic 15.6% |
Demographics Similar to Asians by Unemployment Among Youth under 25 years
In terms of unemployment among youth under 25 years, the demographic groups most similar to Asians are Romanian (11.4%, a difference of 0.030%), Immigrants from Oceania (11.4%, a difference of 0.040%), Immigrants from Chile (11.4%, a difference of 0.050%), Immigrants from England (11.5%, a difference of 0.10%), and Immigrants from Indonesia (11.5%, a difference of 0.13%).
| Demographics | Rating | Rank | Unemployment Among Youth under 25 years |
| Hungarians | 85.7 /100 | #130 | Excellent 11.4% |
| Immigrants | Spain | 84.6 /100 | #131 | Excellent 11.4% |
| Ethiopians | 83.2 /100 | #132 | Excellent 11.4% |
| Lebanese | 83.1 /100 | #133 | Excellent 11.4% |
| Immigrants | Chile | 80.4 /100 | #134 | Excellent 11.4% |
| Immigrants | Oceania | 80.2 /100 | #135 | Excellent 11.4% |
| Romanians | 80.1 /100 | #136 | Excellent 11.4% |
| Asians | 79.7 /100 | #137 | Good 11.4% |
| Immigrants | England | 78.1 /100 | #138 | Good 11.5% |
| Immigrants | Indonesia | 77.6 /100 | #139 | Good 11.5% |
| Immigrants | Belgium | 77.5 /100 | #140 | Good 11.5% |
| Immigrants | Uruguay | 76.1 /100 | #141 | Good 11.5% |
| Immigrants | Korea | 75.1 /100 | #142 | Good 11.5% |
| Immigrants | Uganda | 74.5 /100 | #143 | Good 11.5% |
| Immigrants | Brazil | 74.3 /100 | #144 | Good 11.5% |