Immigrants from Colombia vs Uruguayan Unemployment Among Ages 16 to 19 years
COMPARE
Immigrants from Colombia
Uruguayan
Unemployment Among Ages 16 to 19 years
Unemployment Among Ages 16 to 19 years Comparison
Immigrants from Colombia
Uruguayans
18.3%
UNEMPLOYMENT AMONG AGES 16 TO 19 YEARS
2.7/ 100
METRIC RATING
236th/ 347
METRIC RANK
17.5%
UNEMPLOYMENT AMONG AGES 16 TO 19 YEARS
64.3/ 100
METRIC RATING
157th/ 347
METRIC RANK
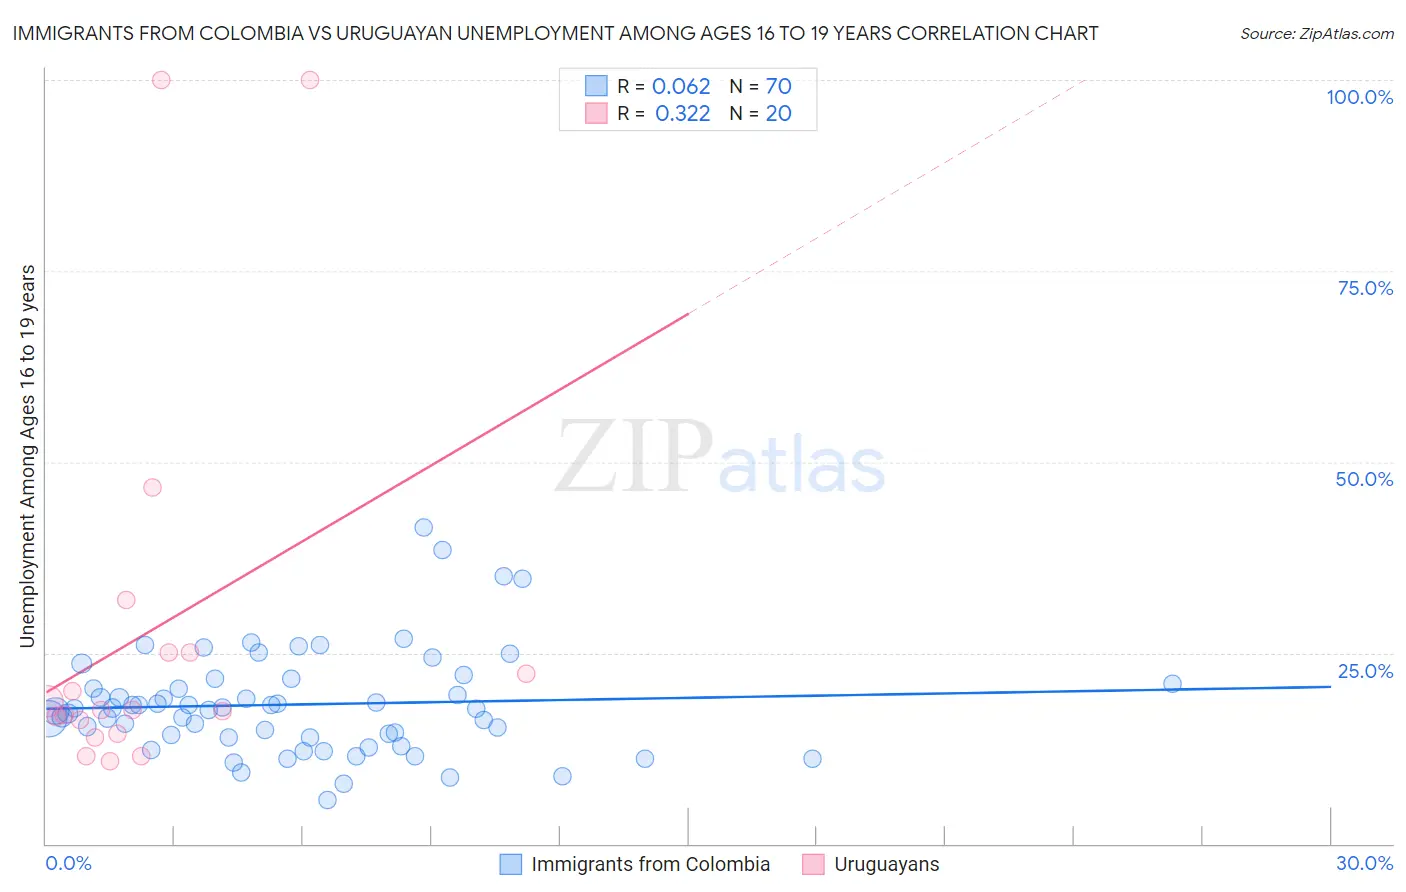
Immigrants from Colombia vs Uruguayan Unemployment Among Ages 16 to 19 years Correlation Chart
The statistical analysis conducted on geographies consisting of 360,806,237 people shows a slight positive correlation between the proportion of Immigrants from Colombia and unemployment rate among population between the ages 16 and 19 in the United States with a correlation coefficient (R) of 0.062 and weighted average of 18.3%. Similarly, the statistical analysis conducted on geographies consisting of 141,401,091 people shows a mild positive correlation between the proportion of Uruguayans and unemployment rate among population between the ages 16 and 19 in the United States with a correlation coefficient (R) of 0.322 and weighted average of 17.5%, a difference of 5.0%.
Unemployment Among Ages 16 to 19 years Correlation Summary
| Measurement | Immigrants from Colombia | Uruguayan |
| Minimum | 5.8% | 10.8% |
| Maximum | 41.3% | 100.0% |
| Range | 35.6% | 89.2% |
| Mean | 18.2% | 27.7% |
| Median | 17.7% | 17.5% |
| Interquartile 25% (IQ1) | 13.9% | 15.3% |
| Interquartile 75% (IQ3) | 20.9% | 25.0% |
| Interquartile Range (IQR) | 7.0% | 9.7% |
| Standard Deviation (Sample) | 6.8% | 26.0% |
| Standard Deviation (Population) | 6.8% | 25.4% |
Similar Demographics by Unemployment Among Ages 16 to 19 years
Demographics Similar to Immigrants from Colombia by Unemployment Among Ages 16 to 19 years
In terms of unemployment among ages 16 to 19 years, the demographic groups most similar to Immigrants from Colombia are Immigrants (18.3%, a difference of 0.020%), South American (18.3%, a difference of 0.030%), French American Indian (18.3%, a difference of 0.070%), Native Hawaiian (18.3%, a difference of 0.11%), and Immigrants from Cabo Verde (18.4%, a difference of 0.33%).
| Demographics | Rating | Rank | Unemployment Among Ages 16 to 19 years |
| Albanians | 5.8 /100 | #229 | Tragic 18.2% |
| Spanish Americans | 4.7 /100 | #230 | Tragic 18.2% |
| Nepalese | 4.2 /100 | #231 | Tragic 18.2% |
| Immigrants | Russia | 4.0 /100 | #232 | Tragic 18.2% |
| Seminole | 4.0 /100 | #233 | Tragic 18.2% |
| Colombians | 3.7 /100 | #234 | Tragic 18.3% |
| French American Indians | 2.9 /100 | #235 | Tragic 18.3% |
| Immigrants | Colombia | 2.7 /100 | #236 | Tragic 18.3% |
| Immigrants | Immigrants | 2.7 /100 | #237 | Tragic 18.3% |
| South Americans | 2.6 /100 | #238 | Tragic 18.3% |
| Native Hawaiians | 2.4 /100 | #239 | Tragic 18.3% |
| Immigrants | Cabo Verde | 2.0 /100 | #240 | Tragic 18.4% |
| Immigrants | Ukraine | 1.3 /100 | #241 | Tragic 18.5% |
| Moroccans | 1.1 /100 | #242 | Tragic 18.5% |
| Mexicans | 0.9 /100 | #243 | Tragic 18.5% |
Demographics Similar to Uruguayans by Unemployment Among Ages 16 to 19 years
In terms of unemployment among ages 16 to 19 years, the demographic groups most similar to Uruguayans are Immigrants from China (17.5%, a difference of 0.010%), Costa Rican (17.4%, a difference of 0.080%), Portuguese (17.4%, a difference of 0.16%), Korean (17.5%, a difference of 0.17%), and Ukrainian (17.5%, a difference of 0.19%).
| Demographics | Rating | Rank | Unemployment Among Ages 16 to 19 years |
| Immigrants | Northern Europe | 72.5 /100 | #150 | Good 17.4% |
| Immigrants | Hong Kong | 69.3 /100 | #151 | Good 17.4% |
| Immigrants | Northern Africa | 69.0 /100 | #152 | Good 17.4% |
| Immigrants | Afghanistan | 68.6 /100 | #153 | Good 17.4% |
| Afghans | 68.1 /100 | #154 | Good 17.4% |
| Portuguese | 67.3 /100 | #155 | Good 17.4% |
| Costa Ricans | 65.9 /100 | #156 | Good 17.4% |
| Uruguayans | 64.3 /100 | #157 | Good 17.5% |
| Immigrants | China | 64.1 /100 | #158 | Good 17.5% |
| Koreans | 61.0 /100 | #159 | Good 17.5% |
| Ukrainians | 60.5 /100 | #160 | Good 17.5% |
| Immigrants | Denmark | 60.3 /100 | #161 | Good 17.5% |
| Immigrants | Norway | 59.8 /100 | #162 | Average 17.5% |
| Egyptians | 59.7 /100 | #163 | Average 17.5% |
| Immigrants | Austria | 57.7 /100 | #164 | Average 17.5% |