Immigrants from Central America vs Immigrants from Sierra Leone Unemployment Among Ages 60 to 64 years
COMPARE
Immigrants from Central America
Immigrants from Sierra Leone
Unemployment Among Ages 60 to 64 years
Unemployment Among Ages 60 to 64 years Comparison
Immigrants from Central America
Immigrants from Sierra Leone
5.4%
UNEMPLOYMENT AMONG AGES 60 TO 64 YEARS
0.0/ 100
METRIC RATING
298th/ 347
METRIC RANK
5.0%
UNEMPLOYMENT AMONG AGES 60 TO 64 YEARS
3.1/ 100
METRIC RATING
236th/ 347
METRIC RANK
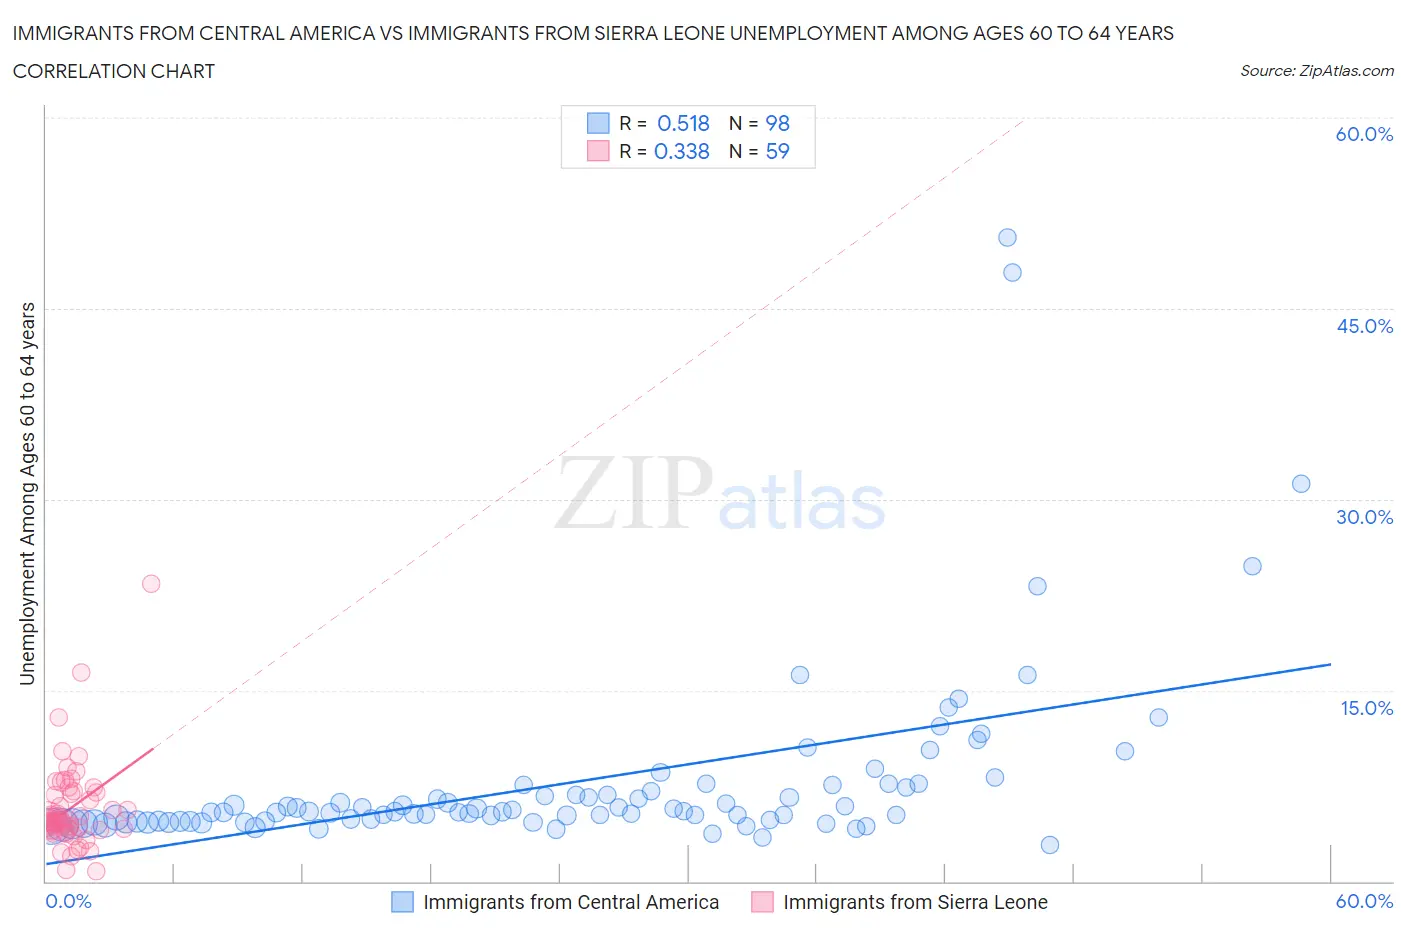
Immigrants from Central America vs Immigrants from Sierra Leone Unemployment Among Ages 60 to 64 years Correlation Chart
The statistical analysis conducted on geographies consisting of 450,671,068 people shows a substantial positive correlation between the proportion of Immigrants from Central America and unemployment rate among population between the ages 60 and 64 in the United States with a correlation coefficient (R) of 0.518 and weighted average of 5.4%. Similarly, the statistical analysis conducted on geographies consisting of 98,057,510 people shows a mild positive correlation between the proportion of Immigrants from Sierra Leone and unemployment rate among population between the ages 60 and 64 in the United States with a correlation coefficient (R) of 0.338 and weighted average of 5.0%, a difference of 7.1%.
Unemployment Among Ages 60 to 64 years Correlation Summary
| Measurement | Immigrants from Central America | Immigrants from Sierra Leone |
| Minimum | 2.9% | 0.80% |
| Maximum | 50.6% | 23.4% |
| Range | 47.7% | 22.6% |
| Mean | 7.8% | 5.7% |
| Median | 5.5% | 4.8% |
| Interquartile 25% (IQ1) | 4.7% | 4.1% |
| Interquartile 75% (IQ3) | 7.3% | 7.0% |
| Interquartile Range (IQR) | 2.6% | 2.9% |
| Standard Deviation (Sample) | 7.4% | 3.5% |
| Standard Deviation (Population) | 7.4% | 3.5% |
Similar Demographics by Unemployment Among Ages 60 to 64 years
Demographics Similar to Immigrants from Central America by Unemployment Among Ages 60 to 64 years
In terms of unemployment among ages 60 to 64 years, the demographic groups most similar to Immigrants from Central America are Osage (5.4%, a difference of 0.050%), Immigrants from El Salvador (5.4%, a difference of 0.050%), Immigrants from Barbados (5.4%, a difference of 0.080%), Immigrants from Jamaica (5.4%, a difference of 0.10%), and Barbadian (5.4%, a difference of 0.50%).
| Demographics | Rating | Rank | Unemployment Among Ages 60 to 64 years |
| Hispanics or Latinos | 0.0 /100 | #291 | Tragic 5.3% |
| Immigrants | Latin America | 0.0 /100 | #292 | Tragic 5.3% |
| Immigrants | Israel | 0.0 /100 | #293 | Tragic 5.3% |
| Blacks/African Americans | 0.0 /100 | #294 | Tragic 5.3% |
| Armenians | 0.0 /100 | #295 | Tragic 5.3% |
| Jamaicans | 0.0 /100 | #296 | Tragic 5.3% |
| Osage | 0.0 /100 | #297 | Tragic 5.4% |
| Immigrants | Central America | 0.0 /100 | #298 | Tragic 5.4% |
| Immigrants | El Salvador | 0.0 /100 | #299 | Tragic 5.4% |
| Immigrants | Barbados | 0.0 /100 | #300 | Tragic 5.4% |
| Immigrants | Jamaica | 0.0 /100 | #301 | Tragic 5.4% |
| Barbadians | 0.0 /100 | #302 | Tragic 5.4% |
| Bahamians | 0.0 /100 | #303 | Tragic 5.4% |
| Immigrants | Mexico | 0.0 /100 | #304 | Tragic 5.4% |
| Cypriots | 0.0 /100 | #305 | Tragic 5.4% |
Demographics Similar to Immigrants from Sierra Leone by Unemployment Among Ages 60 to 64 years
In terms of unemployment among ages 60 to 64 years, the demographic groups most similar to Immigrants from Sierra Leone are Immigrants from Western Asia (5.0%, a difference of 0.040%), Immigrants from Poland (5.0%, a difference of 0.040%), Delaware (5.0%, a difference of 0.13%), Ghanaian (5.0%, a difference of 0.22%), and Iranian (5.0%, a difference of 0.26%).
| Demographics | Rating | Rank | Unemployment Among Ages 60 to 64 years |
| Africans | 5.9 /100 | #229 | Tragic 5.0% |
| Immigrants | Denmark | 5.8 /100 | #230 | Tragic 5.0% |
| Tohono O'odham | 5.7 /100 | #231 | Tragic 5.0% |
| Immigrants | Eastern Asia | 4.7 /100 | #232 | Tragic 5.0% |
| Immigrants | Greece | 4.6 /100 | #233 | Tragic 5.0% |
| Iranians | 4.2 /100 | #234 | Tragic 5.0% |
| Delaware | 3.6 /100 | #235 | Tragic 5.0% |
| Immigrants | Sierra Leone | 3.1 /100 | #236 | Tragic 5.0% |
| Immigrants | Western Asia | 3.0 /100 | #237 | Tragic 5.0% |
| Immigrants | Poland | 3.0 /100 | #238 | Tragic 5.0% |
| Ghanaians | 2.4 /100 | #239 | Tragic 5.0% |
| Immigrants | Croatia | 2.2 /100 | #240 | Tragic 5.0% |
| Indians (Asian) | 2.2 /100 | #241 | Tragic 5.0% |
| Argentineans | 2.1 /100 | #242 | Tragic 5.0% |
| Immigrants | Philippines | 1.9 /100 | #243 | Tragic 5.0% |