Immigrants from Caribbean vs Mexican American Indian Unemployment Among Women with Children Ages 6 to 17 years
COMPARE
Immigrants from Caribbean
Mexican American Indian
Unemployment Among Women with Children Ages 6 to 17 years
Unemployment Among Women with Children Ages 6 to 17 years Comparison
Immigrants from Caribbean
Mexican American Indians
10.1%
UNEMPLOYMENT AMONG WOMEN WITH CHILDREN AGES 6 TO 17 YEARS
0.0/ 100
METRIC RATING
297th/ 347
METRIC RANK
8.9%
UNEMPLOYMENT AMONG WOMEN WITH CHILDREN AGES 6 TO 17 YEARS
60.6/ 100
METRIC RATING
163rd/ 347
METRIC RANK
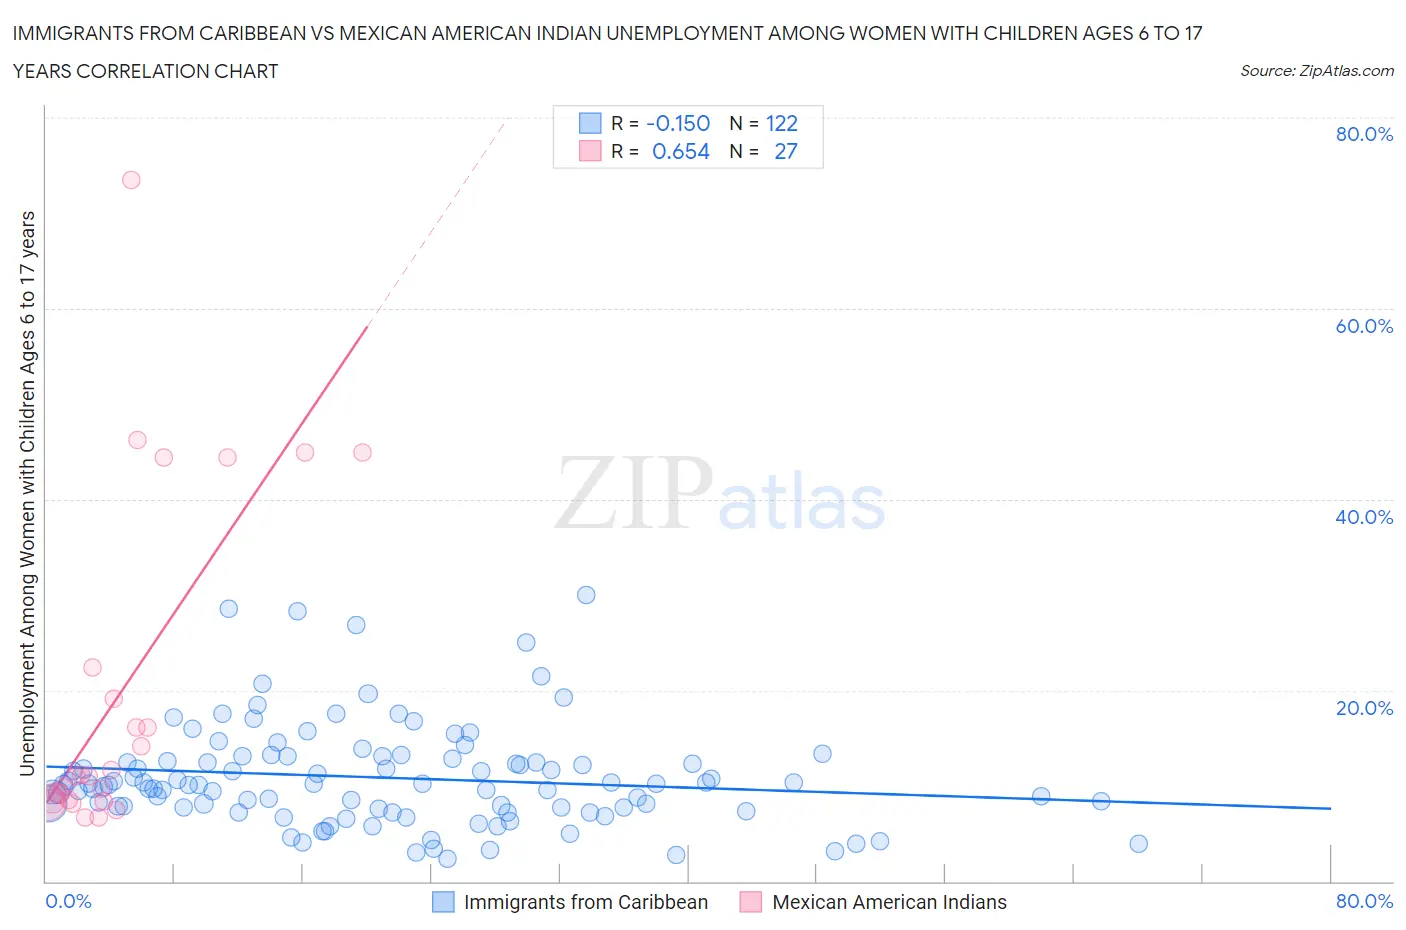
Immigrants from Caribbean vs Mexican American Indian Unemployment Among Women with Children Ages 6 to 17 years Correlation Chart
The statistical analysis conducted on geographies consisting of 317,614,435 people shows a poor negative correlation between the proportion of Immigrants from Caribbean and unemployment rate among women with children between the ages 6 and 17 in the United States with a correlation coefficient (R) of -0.150 and weighted average of 10.1%. Similarly, the statistical analysis conducted on geographies consisting of 246,437,451 people shows a significant positive correlation between the proportion of Mexican American Indians and unemployment rate among women with children between the ages 6 and 17 in the United States with a correlation coefficient (R) of 0.654 and weighted average of 8.9%, a difference of 12.8%.
Unemployment Among Women with Children Ages 6 to 17 years Correlation Summary
| Measurement | Immigrants from Caribbean | Mexican American Indian |
| Minimum | 2.4% | 6.6% |
| Maximum | 30.0% | 73.5% |
| Range | 27.6% | 66.9% |
| Mean | 10.9% | 19.7% |
| Median | 10.1% | 11.0% |
| Interquartile 25% (IQ1) | 7.7% | 8.4% |
| Interquartile 75% (IQ3) | 12.8% | 22.4% |
| Interquartile Range (IQR) | 5.1% | 14.0% |
| Standard Deviation (Sample) | 5.3% | 17.5% |
| Standard Deviation (Population) | 5.3% | 17.2% |
Similar Demographics by Unemployment Among Women with Children Ages 6 to 17 years
Demographics Similar to Immigrants from Caribbean by Unemployment Among Women with Children Ages 6 to 17 years
In terms of unemployment among women with children ages 6 to 17 years, the demographic groups most similar to Immigrants from Caribbean are Immigrants from Western Africa (10.1%, a difference of 0.020%), Immigrants from Haiti (10.1%, a difference of 0.30%), Immigrants from Honduras (10.1%, a difference of 0.32%), Nigerian (10.1%, a difference of 0.34%), and Cherokee (10.0%, a difference of 0.36%).
| Demographics | Rating | Rank | Unemployment Among Women with Children Ages 6 to 17 years |
| Sub-Saharan Africans | 0.0 /100 | #290 | Tragic 10.0% |
| Immigrants | Nonimmigrants | 0.0 /100 | #291 | Tragic 10.0% |
| Carpatho Rusyns | 0.0 /100 | #292 | Tragic 10.0% |
| Haitians | 0.0 /100 | #293 | Tragic 10.0% |
| Ecuadorians | 0.0 /100 | #294 | Tragic 10.0% |
| Cherokee | 0.0 /100 | #295 | Tragic 10.0% |
| Immigrants | Western Africa | 0.0 /100 | #296 | Tragic 10.1% |
| Immigrants | Caribbean | 0.0 /100 | #297 | Tragic 10.1% |
| Immigrants | Haiti | 0.0 /100 | #298 | Tragic 10.1% |
| Immigrants | Honduras | 0.0 /100 | #299 | Tragic 10.1% |
| Nigerians | 0.0 /100 | #300 | Tragic 10.1% |
| Immigrants | Bahamas | 0.0 /100 | #301 | Tragic 10.1% |
| Venezuelans | 0.0 /100 | #302 | Tragic 10.2% |
| Immigrants | Ecuador | 0.0 /100 | #303 | Tragic 10.2% |
| Immigrants | Venezuela | 0.0 /100 | #304 | Tragic 10.2% |
Demographics Similar to Mexican American Indians by Unemployment Among Women with Children Ages 6 to 17 years
In terms of unemployment among women with children ages 6 to 17 years, the demographic groups most similar to Mexican American Indians are Immigrants from Netherlands (8.9%, a difference of 0.010%), Ukrainian (8.9%, a difference of 0.040%), Immigrants from Micronesia (8.9%, a difference of 0.060%), Moroccan (8.9%, a difference of 0.10%), and Immigrants from Guyana (8.9%, a difference of 0.11%).
| Demographics | Rating | Rank | Unemployment Among Women with Children Ages 6 to 17 years |
| Osage | 65.9 /100 | #156 | Good 8.9% |
| Immigrants | Belgium | 65.6 /100 | #157 | Good 8.9% |
| Immigrants | Chile | 65.3 /100 | #158 | Good 8.9% |
| Spanish | 63.8 /100 | #159 | Good 8.9% |
| Immigrants | Hungary | 63.4 /100 | #160 | Good 8.9% |
| Immigrants | Guyana | 63.0 /100 | #161 | Good 8.9% |
| Immigrants | Netherlands | 60.8 /100 | #162 | Good 8.9% |
| Mexican American Indians | 60.6 /100 | #163 | Good 8.9% |
| Ukrainians | 59.7 /100 | #164 | Average 8.9% |
| Immigrants | Micronesia | 59.2 /100 | #165 | Average 8.9% |
| Moroccans | 58.3 /100 | #166 | Average 8.9% |
| Immigrants | England | 57.7 /100 | #167 | Average 8.9% |
| Immigrants | Croatia | 57.1 /100 | #168 | Average 8.9% |
| British | 55.2 /100 | #169 | Average 8.9% |
| Turks | 54.1 /100 | #170 | Average 8.9% |