Immigrants from Caribbean vs Aleut Unemployment Among Ages 35 to 44 years
COMPARE
Immigrants from Caribbean
Aleut
Unemployment Among Ages 35 to 44 years
Unemployment Among Ages 35 to 44 years Comparison
Immigrants from Caribbean
Aleuts
5.4%
UNEMPLOYMENT AMONG AGES 35 TO 44 YEARS
0.0/ 100
METRIC RATING
277th/ 347
METRIC RANK
5.6%
UNEMPLOYMENT AMONG AGES 35 TO 44 YEARS
0.0/ 100
METRIC RATING
298th/ 347
METRIC RANK
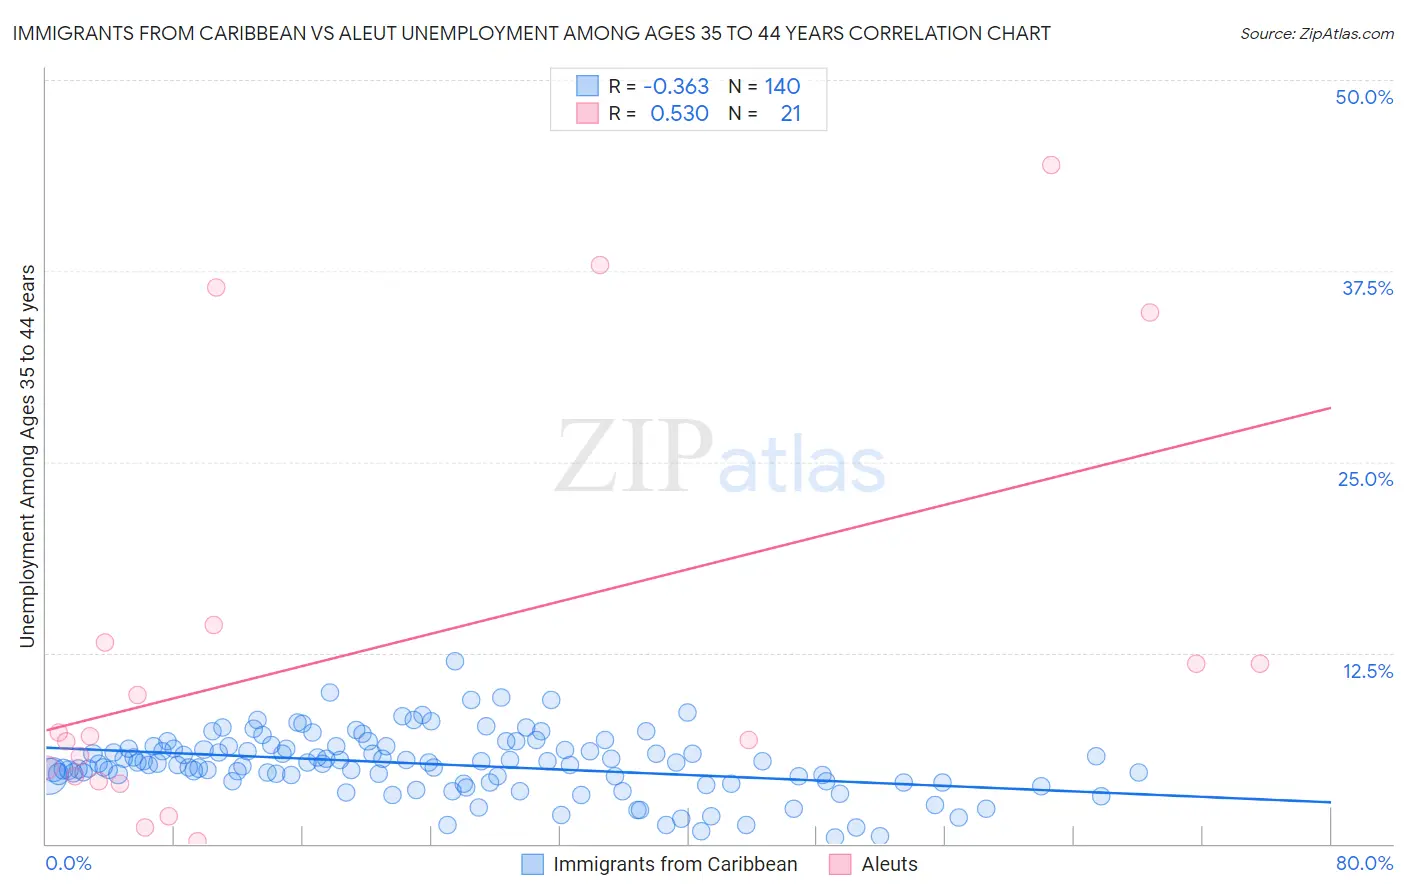
Immigrants from Caribbean vs Aleut Unemployment Among Ages 35 to 44 years Correlation Chart
The statistical analysis conducted on geographies consisting of 437,033,132 people shows a mild negative correlation between the proportion of Immigrants from Caribbean and unemployment rate among population between the ages 35 and 44 in the United States with a correlation coefficient (R) of -0.363 and weighted average of 5.4%. Similarly, the statistical analysis conducted on geographies consisting of 61,419,128 people shows a substantial positive correlation between the proportion of Aleuts and unemployment rate among population between the ages 35 and 44 in the United States with a correlation coefficient (R) of 0.530 and weighted average of 5.6%, a difference of 3.9%.
Unemployment Among Ages 35 to 44 years Correlation Summary
| Measurement | Immigrants from Caribbean | Aleut |
| Minimum | 0.40% | 0.20% |
| Maximum | 12.0% | 44.4% |
| Range | 11.6% | 44.2% |
| Mean | 5.2% | 12.8% |
| Median | 5.3% | 7.1% |
| Interquartile 25% (IQ1) | 4.1% | 4.3% |
| Interquartile 75% (IQ3) | 6.3% | 13.8% |
| Interquartile Range (IQR) | 2.2% | 9.5% |
| Standard Deviation (Sample) | 2.0% | 13.4% |
| Standard Deviation (Population) | 2.0% | 13.0% |
Similar Demographics by Unemployment Among Ages 35 to 44 years
Demographics Similar to Immigrants from Caribbean by Unemployment Among Ages 35 to 44 years
In terms of unemployment among ages 35 to 44 years, the demographic groups most similar to Immigrants from Caribbean are Native Hawaiian (5.4%, a difference of 0.080%), Immigrants from Mexico (5.4%, a difference of 0.090%), Creek (5.4%, a difference of 0.16%), Vietnamese (5.4%, a difference of 0.20%), and Lumbee (5.4%, a difference of 0.23%).
| Demographics | Rating | Rank | Unemployment Among Ages 35 to 44 years |
| Blackfeet | 0.0 /100 | #270 | Tragic 5.3% |
| Ute | 0.0 /100 | #271 | Tragic 5.3% |
| Senegalese | 0.0 /100 | #272 | Tragic 5.3% |
| Vietnamese | 0.0 /100 | #273 | Tragic 5.4% |
| Creek | 0.0 /100 | #274 | Tragic 5.4% |
| Immigrants | Mexico | 0.0 /100 | #275 | Tragic 5.4% |
| Native Hawaiians | 0.0 /100 | #276 | Tragic 5.4% |
| Immigrants | Caribbean | 0.0 /100 | #277 | Tragic 5.4% |
| Lumbee | 0.0 /100 | #278 | Tragic 5.4% |
| Immigrants | Senegal | 0.0 /100 | #279 | Tragic 5.4% |
| Ecuadorians | 0.0 /100 | #280 | Tragic 5.4% |
| Immigrants | Portugal | 0.0 /100 | #281 | Tragic 5.4% |
| Immigrants | Ghana | 0.0 /100 | #282 | Tragic 5.4% |
| Immigrants | Ecuador | 0.0 /100 | #283 | Tragic 5.4% |
| Haitians | 0.0 /100 | #284 | Tragic 5.5% |
Demographics Similar to Aleuts by Unemployment Among Ages 35 to 44 years
In terms of unemployment among ages 35 to 44 years, the demographic groups most similar to Aleuts are U.S. Virgin Islander (5.6%, a difference of 0.010%), Immigrants from Jamaica (5.6%, a difference of 0.10%), Immigrants from Trinidad and Tobago (5.6%, a difference of 0.12%), Ottawa (5.6%, a difference of 0.13%), and Immigrants from West Indies (5.6%, a difference of 0.15%).
| Demographics | Rating | Rank | Unemployment Among Ages 35 to 44 years |
| Dutch West Indians | 0.0 /100 | #291 | Tragic 5.5% |
| Immigrants | Haiti | 0.0 /100 | #292 | Tragic 5.5% |
| Central American Indians | 0.0 /100 | #293 | Tragic 5.6% |
| Trinidadians and Tobagonians | 0.0 /100 | #294 | Tragic 5.6% |
| Ottawa | 0.0 /100 | #295 | Tragic 5.6% |
| Immigrants | Trinidad and Tobago | 0.0 /100 | #296 | Tragic 5.6% |
| U.S. Virgin Islanders | 0.0 /100 | #297 | Tragic 5.6% |
| Aleuts | 0.0 /100 | #298 | Tragic 5.6% |
| Immigrants | Jamaica | 0.0 /100 | #299 | Tragic 5.6% |
| Immigrants | West Indies | 0.0 /100 | #300 | Tragic 5.6% |
| Africans | 0.0 /100 | #301 | Tragic 5.6% |
| Nepalese | 0.0 /100 | #302 | Tragic 5.6% |
| Yakama | 0.0 /100 | #303 | Tragic 5.6% |
| West Indians | 0.0 /100 | #304 | Tragic 5.7% |
| Belizeans | 0.0 /100 | #305 | Tragic 5.7% |