Immigrants from Belgium vs Aleut Unemployment Among Ages 35 to 44 years
COMPARE
Immigrants from Belgium
Aleut
Unemployment Among Ages 35 to 44 years
Unemployment Among Ages 35 to 44 years Comparison
Immigrants from Belgium
Aleuts
4.3%
UNEMPLOYMENT AMONG AGES 35 TO 44 YEARS
98.4/ 100
METRIC RATING
46th/ 347
METRIC RANK
5.6%
UNEMPLOYMENT AMONG AGES 35 TO 44 YEARS
0.0/ 100
METRIC RATING
298th/ 347
METRIC RANK
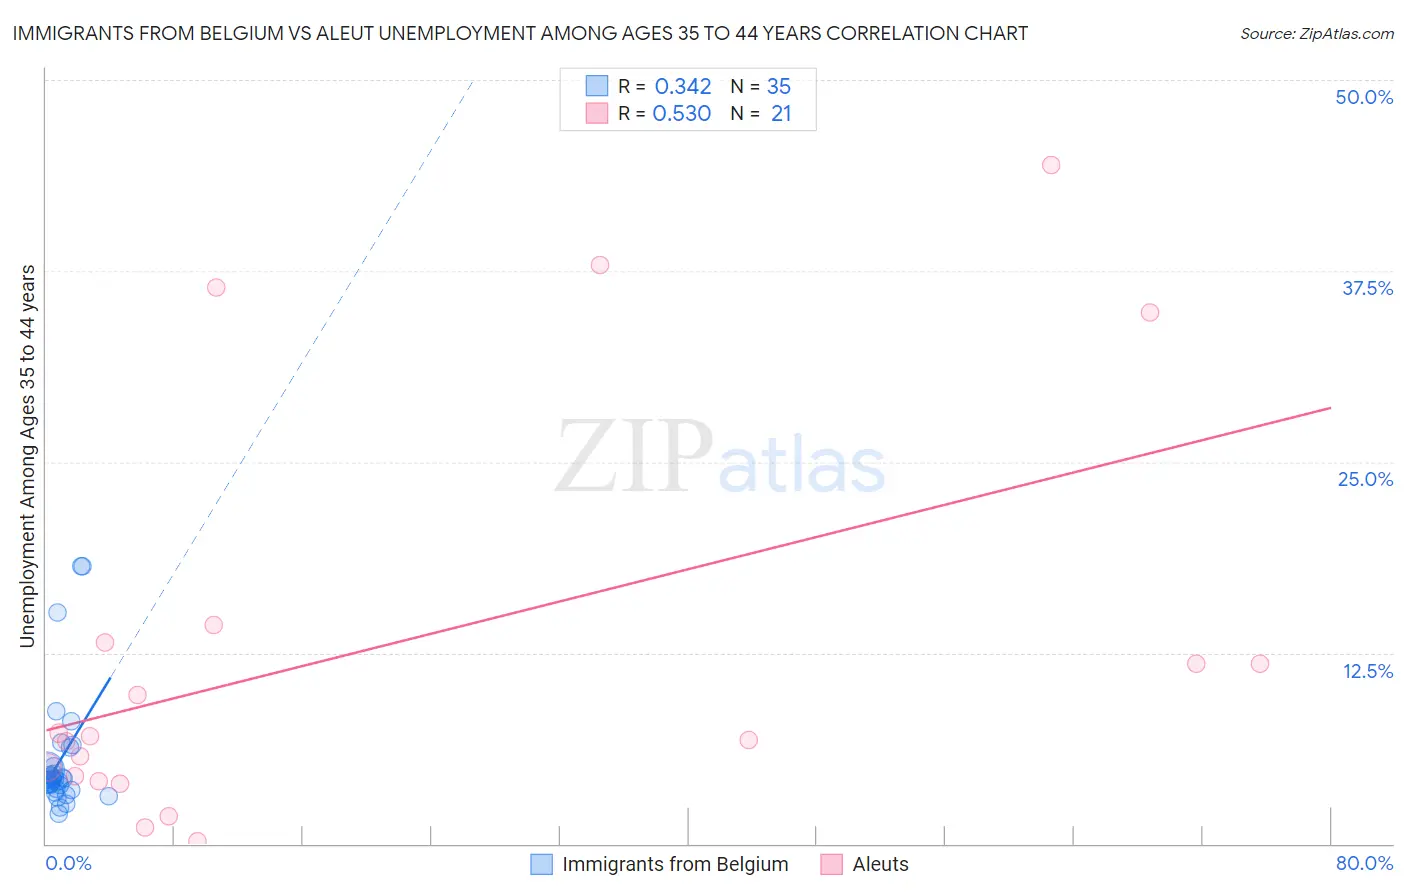
Immigrants from Belgium vs Aleut Unemployment Among Ages 35 to 44 years Correlation Chart
The statistical analysis conducted on geographies consisting of 145,364,037 people shows a mild positive correlation between the proportion of Immigrants from Belgium and unemployment rate among population between the ages 35 and 44 in the United States with a correlation coefficient (R) of 0.342 and weighted average of 4.3%. Similarly, the statistical analysis conducted on geographies consisting of 61,419,128 people shows a substantial positive correlation between the proportion of Aleuts and unemployment rate among population between the ages 35 and 44 in the United States with a correlation coefficient (R) of 0.530 and weighted average of 5.6%, a difference of 28.3%.
Unemployment Among Ages 35 to 44 years Correlation Summary
| Measurement | Immigrants from Belgium | Aleut |
| Minimum | 2.0% | 0.20% |
| Maximum | 18.2% | 44.4% |
| Range | 16.2% | 44.2% |
| Mean | 5.5% | 12.8% |
| Median | 4.2% | 7.1% |
| Interquartile 25% (IQ1) | 3.6% | 4.3% |
| Interquartile 75% (IQ3) | 5.1% | 13.8% |
| Interquartile Range (IQR) | 1.5% | 9.5% |
| Standard Deviation (Sample) | 3.9% | 13.4% |
| Standard Deviation (Population) | 3.9% | 13.0% |
Similar Demographics by Unemployment Among Ages 35 to 44 years
Demographics Similar to Immigrants from Belgium by Unemployment Among Ages 35 to 44 years
In terms of unemployment among ages 35 to 44 years, the demographic groups most similar to Immigrants from Belgium are Immigrants from Korea (4.3%, a difference of 0.010%), British (4.4%, a difference of 0.15%), Bhutanese (4.4%, a difference of 0.24%), Swiss (4.4%, a difference of 0.24%), and Immigrants from Malaysia (4.3%, a difference of 0.33%).
| Demographics | Rating | Rank | Unemployment Among Ages 35 to 44 years |
| Palestinians | 98.8 /100 | #39 | Exceptional 4.3% |
| Zimbabweans | 98.8 /100 | #40 | Exceptional 4.3% |
| Belgians | 98.7 /100 | #41 | Exceptional 4.3% |
| Germans | 98.7 /100 | #42 | Exceptional 4.3% |
| Eastern Europeans | 98.7 /100 | #43 | Exceptional 4.3% |
| Immigrants | Malaysia | 98.7 /100 | #44 | Exceptional 4.3% |
| Immigrants | Korea | 98.4 /100 | #45 | Exceptional 4.3% |
| Immigrants | Belgium | 98.4 /100 | #46 | Exceptional 4.3% |
| British | 98.3 /100 | #47 | Exceptional 4.4% |
| Bhutanese | 98.2 /100 | #48 | Exceptional 4.4% |
| Swiss | 98.2 /100 | #49 | Exceptional 4.4% |
| Immigrants | Turkey | 97.8 /100 | #50 | Exceptional 4.4% |
| Immigrants | Eastern Asia | 97.8 /100 | #51 | Exceptional 4.4% |
| Okinawans | 97.7 /100 | #52 | Exceptional 4.4% |
| Immigrants | Argentina | 97.6 /100 | #53 | Exceptional 4.4% |
Demographics Similar to Aleuts by Unemployment Among Ages 35 to 44 years
In terms of unemployment among ages 35 to 44 years, the demographic groups most similar to Aleuts are U.S. Virgin Islander (5.6%, a difference of 0.010%), Immigrants from Jamaica (5.6%, a difference of 0.10%), Immigrants from Trinidad and Tobago (5.6%, a difference of 0.12%), Ottawa (5.6%, a difference of 0.13%), and Immigrants from West Indies (5.6%, a difference of 0.15%).
| Demographics | Rating | Rank | Unemployment Among Ages 35 to 44 years |
| Dutch West Indians | 0.0 /100 | #291 | Tragic 5.5% |
| Immigrants | Haiti | 0.0 /100 | #292 | Tragic 5.5% |
| Central American Indians | 0.0 /100 | #293 | Tragic 5.6% |
| Trinidadians and Tobagonians | 0.0 /100 | #294 | Tragic 5.6% |
| Ottawa | 0.0 /100 | #295 | Tragic 5.6% |
| Immigrants | Trinidad and Tobago | 0.0 /100 | #296 | Tragic 5.6% |
| U.S. Virgin Islanders | 0.0 /100 | #297 | Tragic 5.6% |
| Aleuts | 0.0 /100 | #298 | Tragic 5.6% |
| Immigrants | Jamaica | 0.0 /100 | #299 | Tragic 5.6% |
| Immigrants | West Indies | 0.0 /100 | #300 | Tragic 5.6% |
| Africans | 0.0 /100 | #301 | Tragic 5.6% |
| Nepalese | 0.0 /100 | #302 | Tragic 5.6% |
| Yakama | 0.0 /100 | #303 | Tragic 5.6% |
| West Indians | 0.0 /100 | #304 | Tragic 5.7% |
| Belizeans | 0.0 /100 | #305 | Tragic 5.7% |