Immigrants from Caribbean vs Immigrants from Russia Unemployment Among Ages 35 to 44 years
COMPARE
Immigrants from Caribbean
Immigrants from Russia
Unemployment Among Ages 35 to 44 years
Unemployment Among Ages 35 to 44 years Comparison
Immigrants from Caribbean
Immigrants from Russia
5.4%
UNEMPLOYMENT AMONG AGES 35 TO 44 YEARS
0.0/ 100
METRIC RATING
277th/ 347
METRIC RANK
4.6%
UNEMPLOYMENT AMONG AGES 35 TO 44 YEARS
75.4/ 100
METRIC RATING
144th/ 347
METRIC RANK
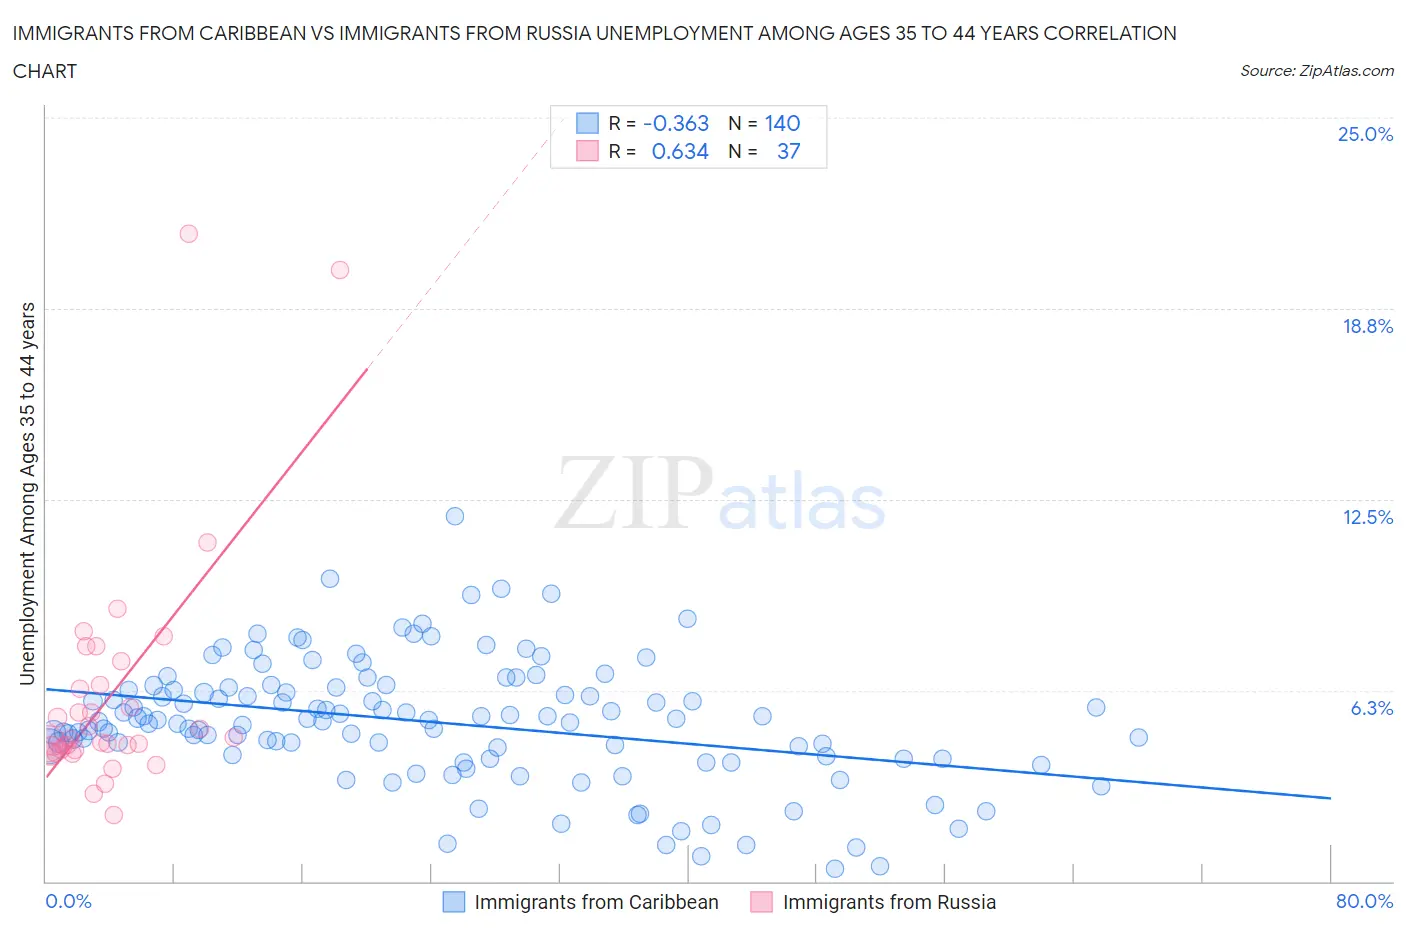
Immigrants from Caribbean vs Immigrants from Russia Unemployment Among Ages 35 to 44 years Correlation Chart
The statistical analysis conducted on geographies consisting of 437,033,132 people shows a mild negative correlation between the proportion of Immigrants from Caribbean and unemployment rate among population between the ages 35 and 44 in the United States with a correlation coefficient (R) of -0.363 and weighted average of 5.4%. Similarly, the statistical analysis conducted on geographies consisting of 341,240,245 people shows a significant positive correlation between the proportion of Immigrants from Russia and unemployment rate among population between the ages 35 and 44 in the United States with a correlation coefficient (R) of 0.634 and weighted average of 4.6%, a difference of 16.8%.
Unemployment Among Ages 35 to 44 years Correlation Summary
| Measurement | Immigrants from Caribbean | Immigrants from Russia |
| Minimum | 0.40% | 2.2% |
| Maximum | 12.0% | 21.2% |
| Range | 11.6% | 19.0% |
| Mean | 5.2% | 6.1% |
| Median | 5.3% | 4.7% |
| Interquartile 25% (IQ1) | 4.1% | 4.3% |
| Interquartile 75% (IQ3) | 6.3% | 6.8% |
| Interquartile Range (IQR) | 2.2% | 2.5% |
| Standard Deviation (Sample) | 2.0% | 3.9% |
| Standard Deviation (Population) | 2.0% | 3.9% |
Similar Demographics by Unemployment Among Ages 35 to 44 years
Demographics Similar to Immigrants from Caribbean by Unemployment Among Ages 35 to 44 years
In terms of unemployment among ages 35 to 44 years, the demographic groups most similar to Immigrants from Caribbean are Native Hawaiian (5.4%, a difference of 0.080%), Immigrants from Mexico (5.4%, a difference of 0.090%), Creek (5.4%, a difference of 0.16%), Vietnamese (5.4%, a difference of 0.20%), and Lumbee (5.4%, a difference of 0.23%).
| Demographics | Rating | Rank | Unemployment Among Ages 35 to 44 years |
| Blackfeet | 0.0 /100 | #270 | Tragic 5.3% |
| Ute | 0.0 /100 | #271 | Tragic 5.3% |
| Senegalese | 0.0 /100 | #272 | Tragic 5.3% |
| Vietnamese | 0.0 /100 | #273 | Tragic 5.4% |
| Creek | 0.0 /100 | #274 | Tragic 5.4% |
| Immigrants | Mexico | 0.0 /100 | #275 | Tragic 5.4% |
| Native Hawaiians | 0.0 /100 | #276 | Tragic 5.4% |
| Immigrants | Caribbean | 0.0 /100 | #277 | Tragic 5.4% |
| Lumbee | 0.0 /100 | #278 | Tragic 5.4% |
| Immigrants | Senegal | 0.0 /100 | #279 | Tragic 5.4% |
| Ecuadorians | 0.0 /100 | #280 | Tragic 5.4% |
| Immigrants | Portugal | 0.0 /100 | #281 | Tragic 5.4% |
| Immigrants | Ghana | 0.0 /100 | #282 | Tragic 5.4% |
| Immigrants | Ecuador | 0.0 /100 | #283 | Tragic 5.4% |
| Haitians | 0.0 /100 | #284 | Tragic 5.5% |
Demographics Similar to Immigrants from Russia by Unemployment Among Ages 35 to 44 years
In terms of unemployment among ages 35 to 44 years, the demographic groups most similar to Immigrants from Russia are Immigrants from Switzerland (4.6%, a difference of 0.010%), Ukrainian (4.6%, a difference of 0.040%), Canadian (4.6%, a difference of 0.050%), Immigrants from Eastern Africa (4.6%, a difference of 0.060%), and Immigrants from Eastern Europe (4.6%, a difference of 0.070%).
| Demographics | Rating | Rank | Unemployment Among Ages 35 to 44 years |
| Immigrants | Iraq | 78.9 /100 | #137 | Good 4.6% |
| Immigrants | Norway | 77.5 /100 | #138 | Good 4.6% |
| Immigrants | Hungary | 76.3 /100 | #139 | Good 4.6% |
| Immigrants | Eastern Africa | 76.0 /100 | #140 | Good 4.6% |
| Canadians | 75.9 /100 | #141 | Good 4.6% |
| Ukrainians | 75.8 /100 | #142 | Good 4.6% |
| Immigrants | Switzerland | 75.5 /100 | #143 | Good 4.6% |
| Immigrants | Russia | 75.4 /100 | #144 | Good 4.6% |
| Immigrants | Eastern Europe | 74.7 /100 | #145 | Good 4.6% |
| Immigrants | Denmark | 74.4 /100 | #146 | Good 4.6% |
| Immigrants | Vietnam | 73.8 /100 | #147 | Good 4.6% |
| Slavs | 72.4 /100 | #148 | Good 4.6% |
| Immigrants | Burma/Myanmar | 72.2 /100 | #149 | Good 4.6% |
| Immigrants | England | 70.5 /100 | #150 | Good 4.6% |
| Puget Sound Salish | 67.1 /100 | #151 | Good 4.6% |