Immigrants from Canada vs Pueblo Unemployment Among Ages 30 to 34 years
COMPARE
Immigrants from Canada
Pueblo
Unemployment Among Ages 30 to 34 years
Unemployment Among Ages 30 to 34 years Comparison
Immigrants from Canada
Pueblo
5.4%
UNEMPLOYMENT AMONG AGES 30 TO 34 YEARS
74.6/ 100
METRIC RATING
137th/ 347
METRIC RANK
8.3%
UNEMPLOYMENT AMONG AGES 30 TO 34 YEARS
0.0/ 100
METRIC RATING
333rd/ 347
METRIC RANK
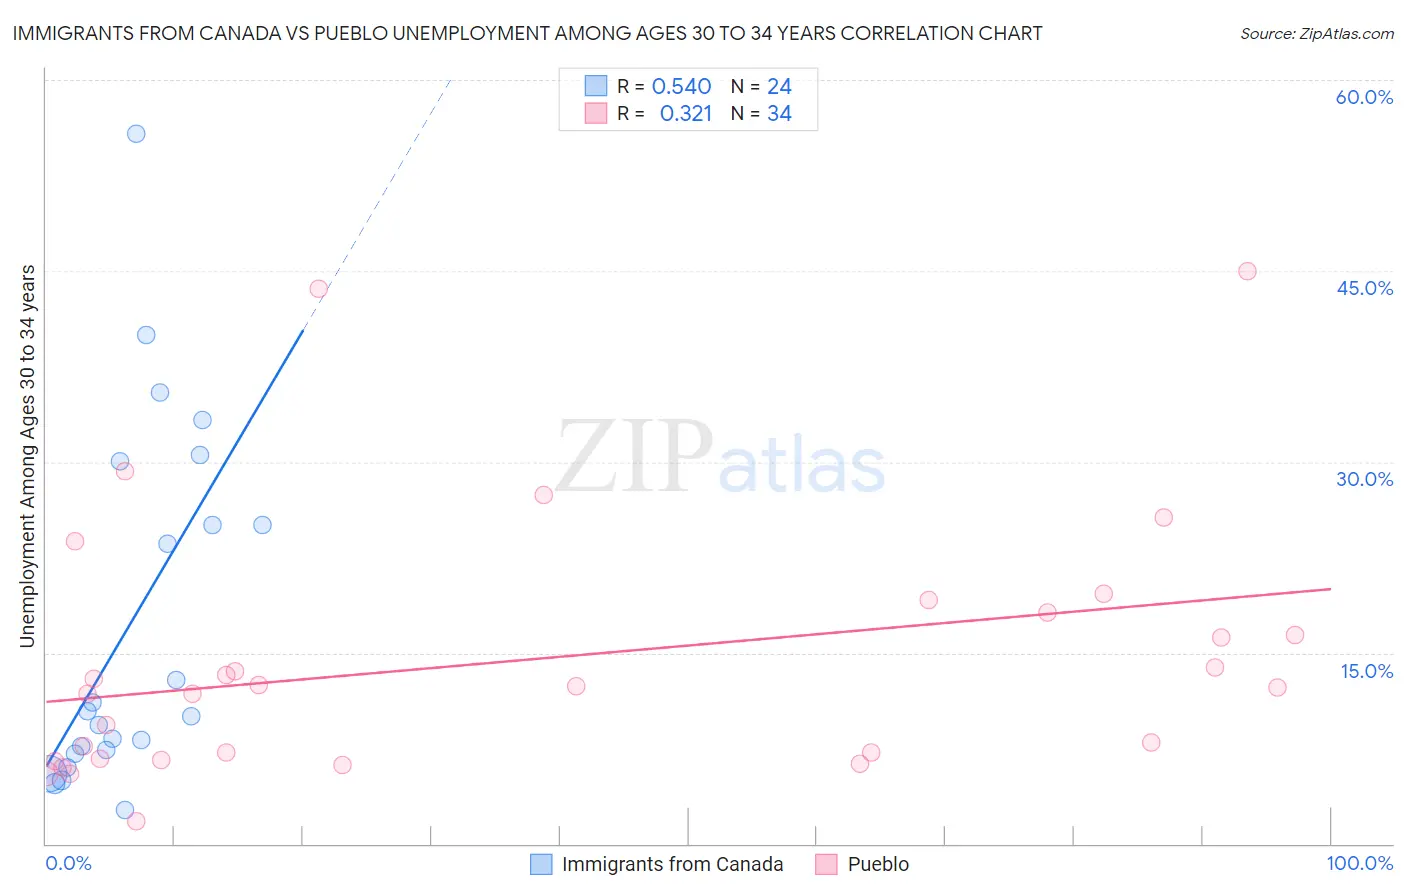
Immigrants from Canada vs Pueblo Unemployment Among Ages 30 to 34 years Correlation Chart
The statistical analysis conducted on geographies consisting of 422,416,239 people shows a substantial positive correlation between the proportion of Immigrants from Canada and unemployment rate among population between the ages 30 and 34 in the United States with a correlation coefficient (R) of 0.540 and weighted average of 5.4%. Similarly, the statistical analysis conducted on geographies consisting of 118,023,595 people shows a mild positive correlation between the proportion of Pueblo and unemployment rate among population between the ages 30 and 34 in the United States with a correlation coefficient (R) of 0.321 and weighted average of 8.3%, a difference of 54.3%.
Unemployment Among Ages 30 to 34 years Correlation Summary
| Measurement | Immigrants from Canada | Pueblo |
| Minimum | 2.7% | 1.8% |
| Maximum | 55.8% | 45.0% |
| Range | 53.1% | 43.2% |
| Mean | 17.3% | 14.4% |
| Median | 10.2% | 12.3% |
| Interquartile 25% (IQ1) | 7.2% | 6.6% |
| Interquartile 75% (IQ3) | 27.5% | 18.2% |
| Interquartile Range (IQR) | 20.3% | 11.6% |
| Standard Deviation (Sample) | 14.1% | 10.2% |
| Standard Deviation (Population) | 13.8% | 10.0% |
Similar Demographics by Unemployment Among Ages 30 to 34 years
Demographics Similar to Immigrants from Canada by Unemployment Among Ages 30 to 34 years
In terms of unemployment among ages 30 to 34 years, the demographic groups most similar to Immigrants from Canada are Pakistani (5.4%, a difference of 0.0%), Palestinian (5.4%, a difference of 0.050%), Serbian (5.4%, a difference of 0.15%), Bangladeshi (5.3%, a difference of 0.19%), and Lithuanian (5.4%, a difference of 0.20%).
| Demographics | Rating | Rank | Unemployment Among Ages 30 to 34 years |
| Germans | 77.8 /100 | #130 | Good 5.3% |
| Immigrants | Eastern Europe | 77.4 /100 | #131 | Good 5.3% |
| Carpatho Rusyns | 77.3 /100 | #132 | Good 5.3% |
| Immigrants | Northern Europe | 77.3 /100 | #133 | Good 5.3% |
| Bangladeshis | 76.6 /100 | #134 | Good 5.3% |
| Palestinians | 75.1 /100 | #135 | Good 5.4% |
| Pakistanis | 74.6 /100 | #136 | Good 5.4% |
| Immigrants | Canada | 74.6 /100 | #137 | Good 5.4% |
| Serbians | 72.9 /100 | #138 | Good 5.4% |
| Lithuanians | 72.4 /100 | #139 | Good 5.4% |
| Immigrants | North America | 72.2 /100 | #140 | Good 5.4% |
| Immigrants | Europe | 72.1 /100 | #141 | Good 5.4% |
| Immigrants | Greece | 72.0 /100 | #142 | Good 5.4% |
| Russians | 71.1 /100 | #143 | Good 5.4% |
| Immigrants | Russia | 71.0 /100 | #144 | Good 5.4% |
Demographics Similar to Pueblo by Unemployment Among Ages 30 to 34 years
In terms of unemployment among ages 30 to 34 years, the demographic groups most similar to Pueblo are Native/Alaskan (8.2%, a difference of 0.43%), Alaska Native (8.5%, a difference of 2.7%), Sioux (8.0%, a difference of 3.1%), Shoshone (7.9%, a difference of 4.5%), and Cheyenne (7.8%, a difference of 5.5%).
| Demographics | Rating | Rank | Unemployment Among Ages 30 to 34 years |
| Dominicans | 0.0 /100 | #326 | Tragic 7.7% |
| Immigrants | Dominican Republic | 0.0 /100 | #327 | Tragic 7.7% |
| Chippewa | 0.0 /100 | #328 | Tragic 7.8% |
| Cheyenne | 0.0 /100 | #329 | Tragic 7.8% |
| Shoshone | 0.0 /100 | #330 | Tragic 7.9% |
| Sioux | 0.0 /100 | #331 | Tragic 8.0% |
| Natives/Alaskans | 0.0 /100 | #332 | Tragic 8.2% |
| Pueblo | 0.0 /100 | #333 | Tragic 8.3% |
| Alaska Natives | 0.0 /100 | #334 | Tragic 8.5% |
| Puerto Ricans | 0.0 /100 | #335 | Tragic 8.9% |
| Colville | 0.0 /100 | #336 | Tragic 9.0% |
| Pima | 0.0 /100 | #337 | Tragic 9.6% |
| Yakama | 0.0 /100 | #338 | Tragic 9.8% |
| Tohono O'odham | 0.0 /100 | #339 | Tragic 9.8% |
| Crow | 0.0 /100 | #340 | Tragic 10.3% |