Immigrants from Canada vs Bolivian Unemployment Among Ages 30 to 34 years
COMPARE
Immigrants from Canada
Bolivian
Unemployment Among Ages 30 to 34 years
Unemployment Among Ages 30 to 34 years Comparison
Immigrants from Canada
Bolivians
5.4%
UNEMPLOYMENT AMONG AGES 30 TO 34 YEARS
74.6/ 100
METRIC RATING
137th/ 347
METRIC RANK
4.9%
UNEMPLOYMENT AMONG AGES 30 TO 34 YEARS
99.8/ 100
METRIC RATING
18th/ 347
METRIC RANK
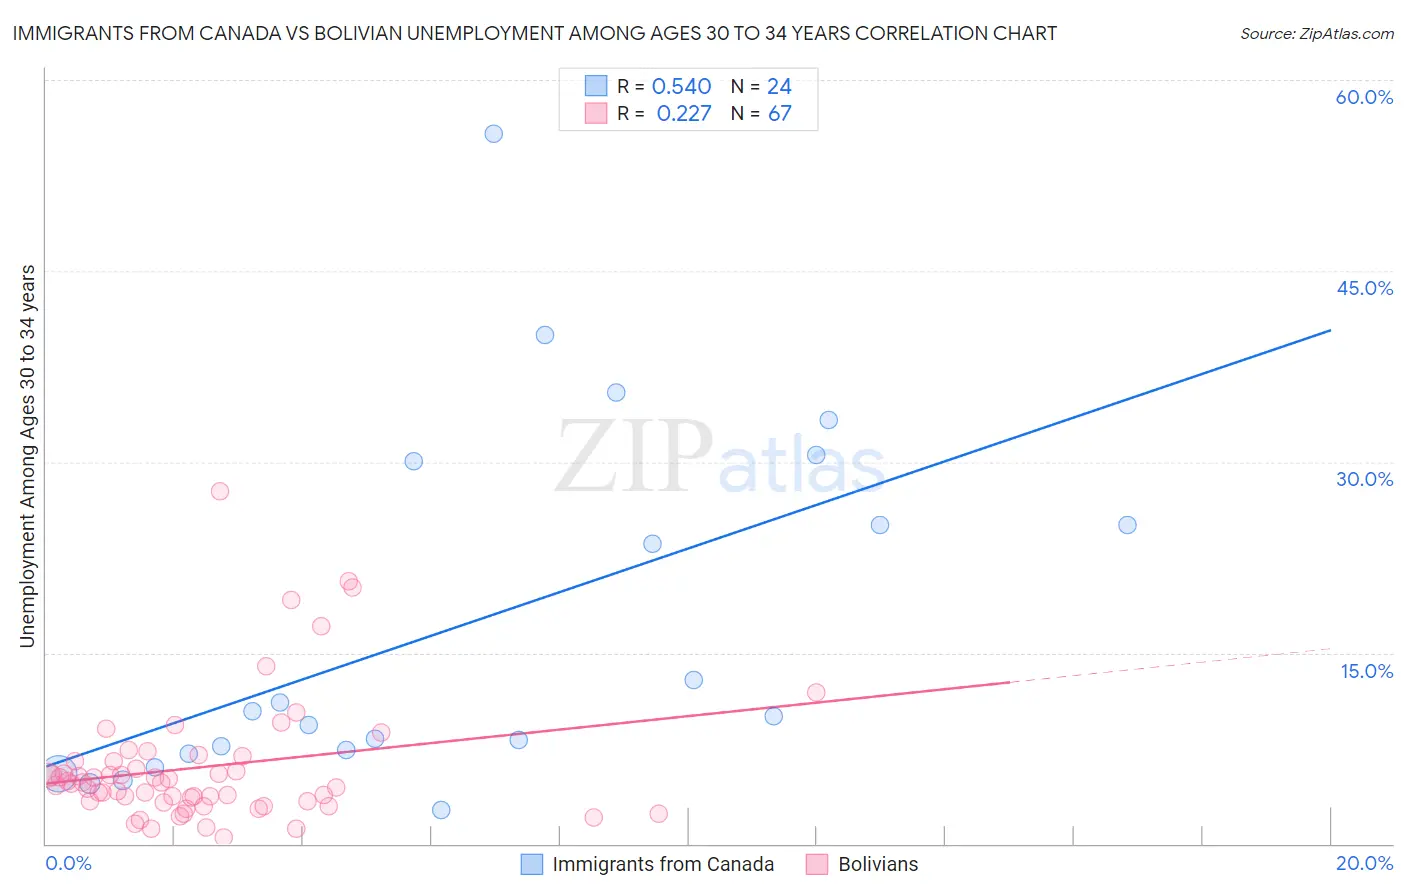
Immigrants from Canada vs Bolivian Unemployment Among Ages 30 to 34 years Correlation Chart
The statistical analysis conducted on geographies consisting of 422,416,239 people shows a substantial positive correlation between the proportion of Immigrants from Canada and unemployment rate among population between the ages 30 and 34 in the United States with a correlation coefficient (R) of 0.540 and weighted average of 5.4%. Similarly, the statistical analysis conducted on geographies consisting of 180,156,446 people shows a weak positive correlation between the proportion of Bolivians and unemployment rate among population between the ages 30 and 34 in the United States with a correlation coefficient (R) of 0.227 and weighted average of 4.9%, a difference of 10.3%.
Unemployment Among Ages 30 to 34 years Correlation Summary
| Measurement | Immigrants from Canada | Bolivian |
| Minimum | 2.7% | 0.50% |
| Maximum | 55.8% | 27.7% |
| Range | 53.1% | 27.2% |
| Mean | 17.3% | 6.0% |
| Median | 10.2% | 4.8% |
| Interquartile 25% (IQ1) | 7.2% | 3.3% |
| Interquartile 75% (IQ3) | 27.5% | 6.5% |
| Interquartile Range (IQR) | 20.3% | 3.2% |
| Standard Deviation (Sample) | 14.1% | 5.0% |
| Standard Deviation (Population) | 13.8% | 5.0% |
Similar Demographics by Unemployment Among Ages 30 to 34 years
Demographics Similar to Immigrants from Canada by Unemployment Among Ages 30 to 34 years
In terms of unemployment among ages 30 to 34 years, the demographic groups most similar to Immigrants from Canada are Pakistani (5.4%, a difference of 0.0%), Palestinian (5.4%, a difference of 0.050%), Serbian (5.4%, a difference of 0.15%), Bangladeshi (5.3%, a difference of 0.19%), and Lithuanian (5.4%, a difference of 0.20%).
| Demographics | Rating | Rank | Unemployment Among Ages 30 to 34 years |
| Germans | 77.8 /100 | #130 | Good 5.3% |
| Immigrants | Eastern Europe | 77.4 /100 | #131 | Good 5.3% |
| Carpatho Rusyns | 77.3 /100 | #132 | Good 5.3% |
| Immigrants | Northern Europe | 77.3 /100 | #133 | Good 5.3% |
| Bangladeshis | 76.6 /100 | #134 | Good 5.3% |
| Palestinians | 75.1 /100 | #135 | Good 5.4% |
| Pakistanis | 74.6 /100 | #136 | Good 5.4% |
| Immigrants | Canada | 74.6 /100 | #137 | Good 5.4% |
| Serbians | 72.9 /100 | #138 | Good 5.4% |
| Lithuanians | 72.4 /100 | #139 | Good 5.4% |
| Immigrants | North America | 72.2 /100 | #140 | Good 5.4% |
| Immigrants | Europe | 72.1 /100 | #141 | Good 5.4% |
| Immigrants | Greece | 72.0 /100 | #142 | Good 5.4% |
| Russians | 71.1 /100 | #143 | Good 5.4% |
| Immigrants | Russia | 71.0 /100 | #144 | Good 5.4% |
Demographics Similar to Bolivians by Unemployment Among Ages 30 to 34 years
In terms of unemployment among ages 30 to 34 years, the demographic groups most similar to Bolivians are Immigrants from Sudan (4.9%, a difference of 0.060%), Immigrants from Taiwan (4.9%, a difference of 0.080%), Ethiopian (4.9%, a difference of 0.090%), Immigrants from South Central Asia (4.9%, a difference of 0.30%), and Immigrants from Bulgaria (4.8%, a difference of 0.40%).
| Demographics | Rating | Rank | Unemployment Among Ages 30 to 34 years |
| Immigrants | Bolivia | 99.9 /100 | #11 | Exceptional 4.8% |
| Filipinos | 99.9 /100 | #12 | Exceptional 4.8% |
| Cambodians | 99.9 /100 | #13 | Exceptional 4.8% |
| Luxembourgers | 99.9 /100 | #14 | Exceptional 4.8% |
| Okinawans | 99.9 /100 | #15 | Exceptional 4.8% |
| Zimbabweans | 99.9 /100 | #16 | Exceptional 4.8% |
| Immigrants | Bulgaria | 99.9 /100 | #17 | Exceptional 4.8% |
| Bolivians | 99.8 /100 | #18 | Exceptional 4.9% |
| Immigrants | Sudan | 99.8 /100 | #19 | Exceptional 4.9% |
| Immigrants | Taiwan | 99.8 /100 | #20 | Exceptional 4.9% |
| Ethiopians | 99.8 /100 | #21 | Exceptional 4.9% |
| Immigrants | South Central Asia | 99.8 /100 | #22 | Exceptional 4.9% |
| Hmong | 99.8 /100 | #23 | Exceptional 4.9% |
| Ugandans | 99.7 /100 | #24 | Exceptional 4.9% |
| Immigrants | Singapore | 99.5 /100 | #25 | Exceptional 5.0% |