Irish vs Pueblo Unemployment Among Ages 30 to 34 years
COMPARE
Irish
Pueblo
Unemployment Among Ages 30 to 34 years
Unemployment Among Ages 30 to 34 years Comparison
Irish
Pueblo
5.5%
UNEMPLOYMENT AMONG AGES 30 TO 34 YEARS
31.3/ 100
METRIC RATING
191st/ 347
METRIC RANK
8.3%
UNEMPLOYMENT AMONG AGES 30 TO 34 YEARS
0.0/ 100
METRIC RATING
333rd/ 347
METRIC RANK
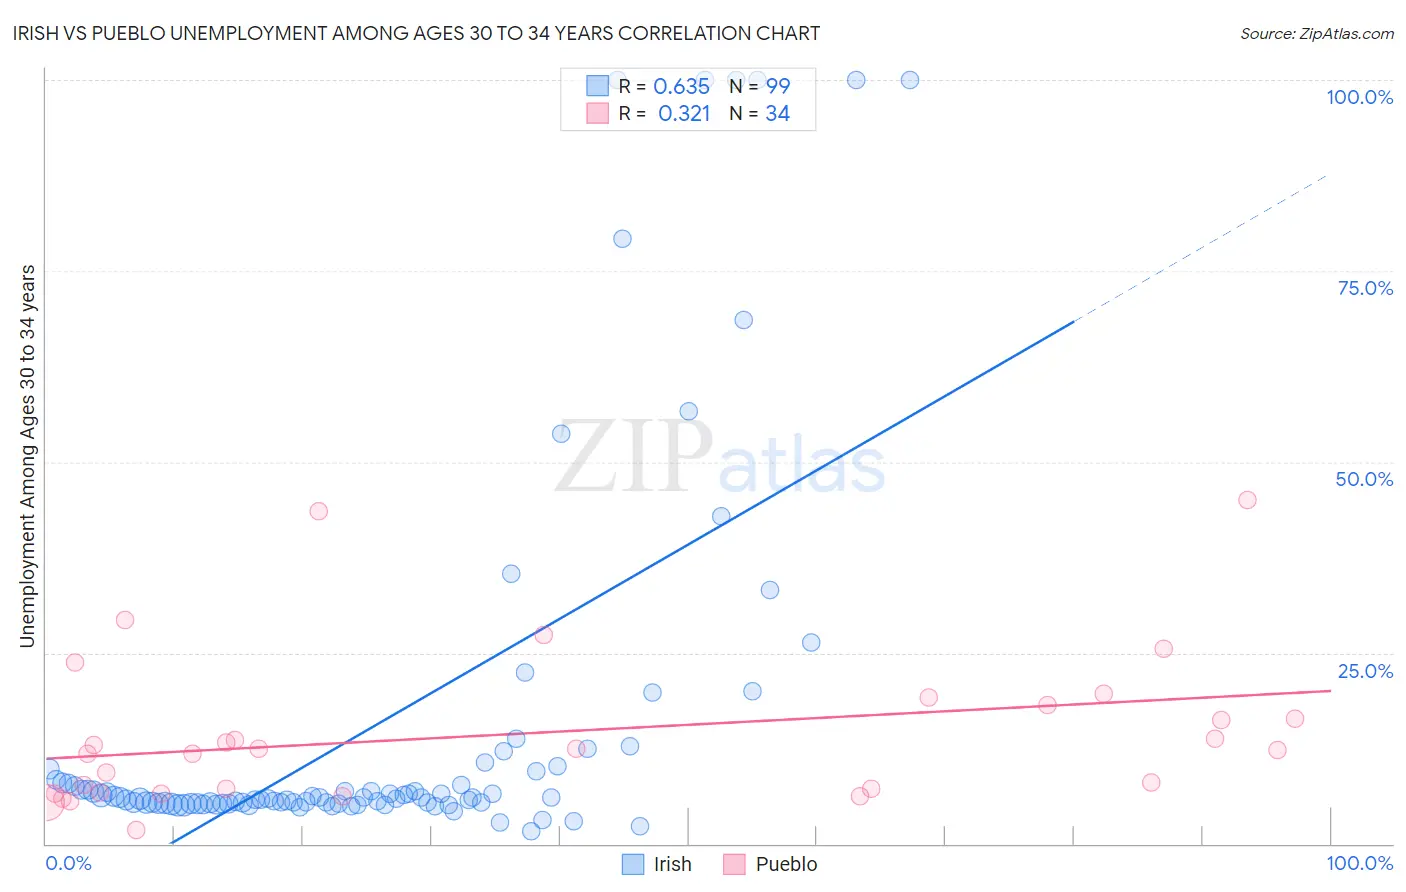
Irish vs Pueblo Unemployment Among Ages 30 to 34 years Correlation Chart
The statistical analysis conducted on geographies consisting of 502,163,490 people shows a significant positive correlation between the proportion of Irish and unemployment rate among population between the ages 30 and 34 in the United States with a correlation coefficient (R) of 0.635 and weighted average of 5.5%. Similarly, the statistical analysis conducted on geographies consisting of 118,023,595 people shows a mild positive correlation between the proportion of Pueblo and unemployment rate among population between the ages 30 and 34 in the United States with a correlation coefficient (R) of 0.321 and weighted average of 8.3%, a difference of 49.4%.
Unemployment Among Ages 30 to 34 years Correlation Summary
| Measurement | Irish | Pueblo |
| Minimum | 1.7% | 1.8% |
| Maximum | 100.0% | 45.0% |
| Range | 98.3% | 43.2% |
| Mean | 15.8% | 14.4% |
| Median | 6.0% | 12.3% |
| Interquartile 25% (IQ1) | 5.3% | 6.6% |
| Interquartile 75% (IQ3) | 9.5% | 18.2% |
| Interquartile Range (IQR) | 4.2% | 11.6% |
| Standard Deviation (Sample) | 25.1% | 10.2% |
| Standard Deviation (Population) | 25.0% | 10.0% |
Similar Demographics by Unemployment Among Ages 30 to 34 years
Demographics Similar to Irish by Unemployment Among Ages 30 to 34 years
In terms of unemployment among ages 30 to 34 years, the demographic groups most similar to Irish are Moroccan (5.5%, a difference of 0.0%), Immigrants from Africa (5.5%, a difference of 0.020%), Slavic (5.5%, a difference of 0.030%), Finnish (5.5%, a difference of 0.050%), and Immigrants from South America (5.5%, a difference of 0.12%).
| Demographics | Rating | Rank | Unemployment Among Ages 30 to 34 years |
| Malaysians | 41.8 /100 | #184 | Average 5.5% |
| Immigrants | Western Europe | 39.1 /100 | #185 | Fair 5.5% |
| Canadians | 38.2 /100 | #186 | Fair 5.5% |
| Immigrants | Western Asia | 38.2 /100 | #187 | Fair 5.5% |
| Immigrants | Norway | 36.1 /100 | #188 | Fair 5.5% |
| Immigrants | England | 35.7 /100 | #189 | Fair 5.5% |
| Immigrants | Kazakhstan | 33.9 /100 | #190 | Fair 5.5% |
| Irish | 31.3 /100 | #191 | Fair 5.5% |
| Moroccans | 31.2 /100 | #192 | Fair 5.5% |
| Immigrants | Africa | 31.0 /100 | #193 | Fair 5.5% |
| Slavs | 30.9 /100 | #194 | Fair 5.5% |
| Finns | 30.7 /100 | #195 | Fair 5.5% |
| Immigrants | South America | 29.8 /100 | #196 | Fair 5.5% |
| Immigrants | Nicaragua | 28.9 /100 | #197 | Fair 5.5% |
| Immigrants | Afghanistan | 27.2 /100 | #198 | Fair 5.6% |
Demographics Similar to Pueblo by Unemployment Among Ages 30 to 34 years
In terms of unemployment among ages 30 to 34 years, the demographic groups most similar to Pueblo are Native/Alaskan (8.2%, a difference of 0.43%), Alaska Native (8.5%, a difference of 2.7%), Sioux (8.0%, a difference of 3.1%), Shoshone (7.9%, a difference of 4.5%), and Cheyenne (7.8%, a difference of 5.5%).
| Demographics | Rating | Rank | Unemployment Among Ages 30 to 34 years |
| Dominicans | 0.0 /100 | #326 | Tragic 7.7% |
| Immigrants | Dominican Republic | 0.0 /100 | #327 | Tragic 7.7% |
| Chippewa | 0.0 /100 | #328 | Tragic 7.8% |
| Cheyenne | 0.0 /100 | #329 | Tragic 7.8% |
| Shoshone | 0.0 /100 | #330 | Tragic 7.9% |
| Sioux | 0.0 /100 | #331 | Tragic 8.0% |
| Natives/Alaskans | 0.0 /100 | #332 | Tragic 8.2% |
| Pueblo | 0.0 /100 | #333 | Tragic 8.3% |
| Alaska Natives | 0.0 /100 | #334 | Tragic 8.5% |
| Puerto Ricans | 0.0 /100 | #335 | Tragic 8.9% |
| Colville | 0.0 /100 | #336 | Tragic 9.0% |
| Pima | 0.0 /100 | #337 | Tragic 9.6% |
| Yakama | 0.0 /100 | #338 | Tragic 9.8% |
| Tohono O'odham | 0.0 /100 | #339 | Tragic 9.8% |
| Crow | 0.0 /100 | #340 | Tragic 10.3% |