Immigrants from Romania vs Immigrants from Brazil Unemployment Among Ages 65 to 74 years
COMPARE
Immigrants from Romania
Immigrants from Brazil
Unemployment Among Ages 65 to 74 years
Unemployment Among Ages 65 to 74 years Comparison
Immigrants from Romania
Immigrants from Brazil
5.3%
UNEMPLOYMENT AMONG AGES 65 TO 74 YEARS
73.5/ 100
METRIC RATING
149th/ 347
METRIC RANK
5.6%
UNEMPLOYMENT AMONG AGES 65 TO 74 YEARS
0.5/ 100
METRIC RATING
253rd/ 347
METRIC RANK
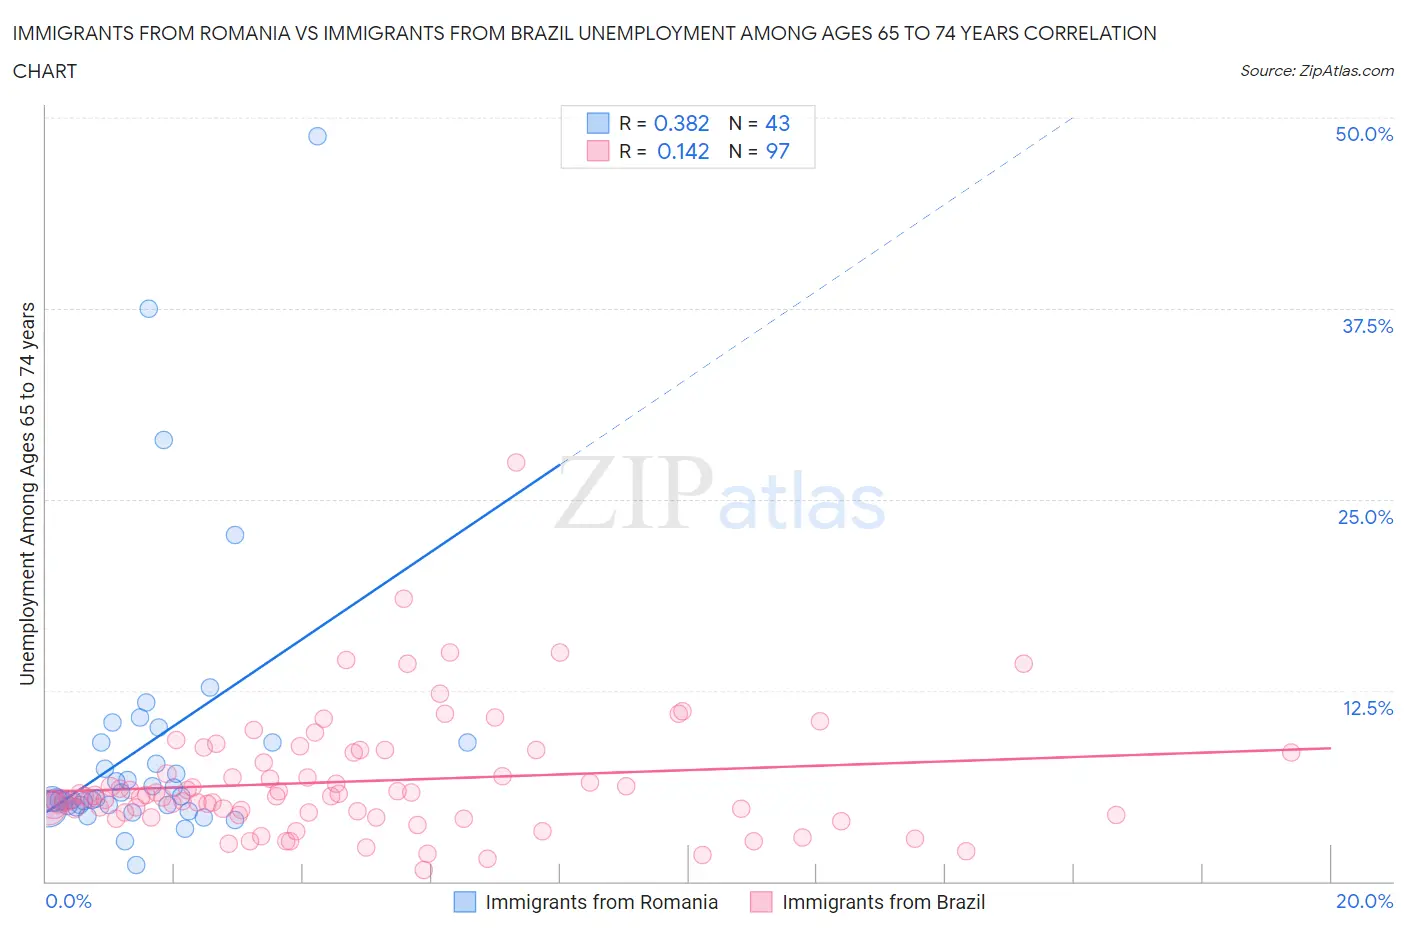
Immigrants from Romania vs Immigrants from Brazil Unemployment Among Ages 65 to 74 years Correlation Chart
The statistical analysis conducted on geographies consisting of 239,287,253 people shows a mild positive correlation between the proportion of Immigrants from Romania and unemployment rate among population between the ages 65 and 74 in the United States with a correlation coefficient (R) of 0.382 and weighted average of 5.3%. Similarly, the statistical analysis conducted on geographies consisting of 309,749,497 people shows a poor positive correlation between the proportion of Immigrants from Brazil and unemployment rate among population between the ages 65 and 74 in the United States with a correlation coefficient (R) of 0.142 and weighted average of 5.6%, a difference of 5.4%.
Unemployment Among Ages 65 to 74 years Correlation Summary
| Measurement | Immigrants from Romania | Immigrants from Brazil |
| Minimum | 1.1% | 0.70% |
| Maximum | 48.8% | 27.4% |
| Range | 47.7% | 26.7% |
| Mean | 8.8% | 6.5% |
| Median | 5.4% | 5.6% |
| Interquartile 25% (IQ1) | 4.9% | 4.4% |
| Interquartile 75% (IQ3) | 9.1% | 8.4% |
| Interquartile Range (IQR) | 4.2% | 4.0% |
| Standard Deviation (Sample) | 9.2% | 4.0% |
| Standard Deviation (Population) | 9.0% | 3.9% |
Similar Demographics by Unemployment Among Ages 65 to 74 years
Demographics Similar to Immigrants from Romania by Unemployment Among Ages 65 to 74 years
In terms of unemployment among ages 65 to 74 years, the demographic groups most similar to Immigrants from Romania are Immigrants from Sri Lanka (5.3%, a difference of 0.010%), Immigrants from Poland (5.3%, a difference of 0.010%), Immigrants from Indonesia (5.3%, a difference of 0.020%), Spanish (5.3%, a difference of 0.040%), and Immigrants from Cabo Verde (5.3%, a difference of 0.040%).
| Demographics | Rating | Rank | Unemployment Among Ages 65 to 74 years |
| Turks | 76.2 /100 | #142 | Good 5.3% |
| New Zealanders | 76.1 /100 | #143 | Good 5.3% |
| Immigrants | Chile | 76.0 /100 | #144 | Good 5.3% |
| Canadians | 75.0 /100 | #145 | Good 5.3% |
| Irish | 74.8 /100 | #146 | Good 5.3% |
| Immigrants | Latvia | 74.6 /100 | #147 | Good 5.3% |
| Immigrants | Sri Lanka | 73.8 /100 | #148 | Good 5.3% |
| Immigrants | Romania | 73.5 /100 | #149 | Good 5.3% |
| Immigrants | Poland | 73.2 /100 | #150 | Good 5.3% |
| Immigrants | Indonesia | 72.9 /100 | #151 | Good 5.3% |
| Spanish | 72.6 /100 | #152 | Good 5.3% |
| Immigrants | Cabo Verde | 72.5 /100 | #153 | Good 5.3% |
| Poles | 72.4 /100 | #154 | Good 5.3% |
| Immigrants | Cameroon | 72.1 /100 | #155 | Good 5.3% |
| Dutch | 72.0 /100 | #156 | Good 5.3% |
Demographics Similar to Immigrants from Brazil by Unemployment Among Ages 65 to 74 years
In terms of unemployment among ages 65 to 74 years, the demographic groups most similar to Immigrants from Brazil are Immigrants from Costa Rica (5.6%, a difference of 0.020%), Colombian (5.6%, a difference of 0.060%), Brazilian (5.6%, a difference of 0.10%), Immigrants from Haiti (5.6%, a difference of 0.11%), and Native Hawaiian (5.6%, a difference of 0.21%).
| Demographics | Rating | Rank | Unemployment Among Ages 65 to 74 years |
| Paraguayans | 0.9 /100 | #246 | Tragic 5.6% |
| Immigrants | Immigrants | 0.9 /100 | #247 | Tragic 5.6% |
| Immigrants | Argentina | 0.9 /100 | #248 | Tragic 5.6% |
| Trinidadians and Tobagonians | 0.8 /100 | #249 | Tragic 5.6% |
| Cape Verdeans | 0.7 /100 | #250 | Tragic 5.6% |
| Brazilians | 0.5 /100 | #251 | Tragic 5.6% |
| Colombians | 0.5 /100 | #252 | Tragic 5.6% |
| Immigrants | Brazil | 0.5 /100 | #253 | Tragic 5.6% |
| Immigrants | Costa Rica | 0.5 /100 | #254 | Tragic 5.6% |
| Immigrants | Haiti | 0.4 /100 | #255 | Tragic 5.6% |
| Native Hawaiians | 0.4 /100 | #256 | Tragic 5.6% |
| Immigrants | Southern Europe | 0.3 /100 | #257 | Tragic 5.6% |
| Immigrants | Western Africa | 0.3 /100 | #258 | Tragic 5.6% |
| Sierra Leoneans | 0.2 /100 | #259 | Tragic 5.6% |
| Immigrants | Barbados | 0.2 /100 | #260 | Tragic 5.6% |