Carpatho Rusyn vs Immigrants from Belize Unemployment Among Ages 20 to 24 years

COMPARE

Carpatho Rusyn
Race
Ancestry
AfghanAfricanAlaska NativeAlaskan AthabascanAlbanianAleutAlsatianAmericanApacheArabArapahoArgentineanArmenianAssyrian/Chaldean/SyriacAustralianAustrianBahamianBangladeshiBarbadianBasqueBelgianBelizeanBermudanBhutaneseBlackfeetBolivianBrazilianBritishBritish West IndianBulgarianBurmeseCajunCambodianCanadianCape VerdeanCarpatho RusynCelticCentral AmericanCentral American IndianCherokeeCheyenneChickasawChileanChineseChippewaChoctawColombianColvilleComancheCosta RicanCreeCreekCroatianCrowCubanCypriotCzechCzechoslovakianDanishDelawareDominicanDutchDutch West IndianEastern EuropeanEcuadorianEgyptianEnglishEstonianEthiopianEuropeanFijianFilipinoFinnishFrenchFrench American IndianFrench CanadianGermanGerman RussianGhanaianGreekGuamanian/ChamorroGuatemalanGuyaneseHaitianHmongHonduranHopiHoumaHungarianIcelanderIndian (Asian)IndonesianInupiatIranianIraqiIrishIroquoisIsraeliItalianJamaicanJapaneseJordanianKenyanKiowaKoreanLaotianLatvianLebaneseLiberianLithuanianLumbeeLuxembourgerMacedonianMalaysianMalteseMarshalleseMenomineeMexicanMexican American IndianMongolianMoroccanNative HawaiianNavajoNepaleseNew ZealanderNicaraguanNigerianNorthern EuropeanNorwegianOkinawanOsageOttawaPaiutePakistaniPalestinianPanamanianParaguayanPennsylvania GermanPeruvianPimaPolishPortuguesePotawatomiPuebloPuerto RicanPuget Sound SalishRomanianRussianSalvadoranSamoanScandinavianScotch-IrishScottishSeminoleSenegaleseSerbianShoshoneSierra LeoneanSiouxSlavicSlovakSloveneSomaliSouth AfricanSouth AmericanSouth American IndianSoviet UnionSpaniardSpanishSpanish AmericanSpanish American IndianSri LankanSubsaharan AfricanSudaneseSwedishSwissSyrianTaiwaneseThaiTlingit-HaidaTohono O'OdhamTonganTrinidadian and TobagonianTsimshianTurkishU.S. Virgin IslanderUgandanUkrainianUruguayanUteVenezuelanVietnameseWelshWest IndianYakamaYaquiYugoslavianYumanYup'ikZimbabwean
Immigration
NonimmigrantsImmigrantsAfghanistanAfricaAlbaniaArgentinaArmeniaAsiaAustraliaAustriaBahamasBangladeshBarbadosBelarusBelgiumBoliviaBosnia and HerzegovinaBrazilBulgariaBurma/MyanmarCabo VerdeCambodiaCameroonCanadaCaribbeanCentral AmericaChileChinaColombiaCongoCosta RicaCroatiaCubaCzechoslovakiaDenmarkDominicaDominican RepublicEastern AfricaEastern AsiaEastern EuropeEcuadorEgyptEl SalvadorEnglandEritreaEthiopiaEuropeFijiFranceGermanyGhanaGreeceGrenadaGuatemalaGuyanaHaitiHondurasHong KongHungaryIndiaIndonesiaIranIraqIrelandIsraelItalyJamaicaJapanJordanKazakhstanKenyaKoreaKuwaitLaosLatin AmericaLatviaLebanonLiberiaLithuaniaMalaysiaMexicoMicronesiaMiddle AfricaMoldovaMoroccoNepalNetherlandsNicaraguaNigeriaNorth AmericaNorth MacedoniaNorthern AfricaNorthern EuropeNorwayOceaniaPakistanPanamaPeruPhilippinesPolandPortugalRomaniaRussiaSaudi ArabiaScotlandSenegalSerbiaSierra LeoneSingaporeSomaliaSouth AfricaSouth AmericaSouth Central AsiaSouth Eastern AsiaSouthern EuropeSpainSri LankaSt. Vincent and the GrenadinesSudanSwedenSwitzerlandSyriaTaiwanThailandTrinidad and TobagoTurkeyUgandaUkraineUruguayUzbekistanVenezuelaVietnamWest IndiesWestern AfricaWestern AsiaWestern EuropeYemenZaireZimbabweAzores
Immigrants from Belize
Race
Ancestry
AfghanAfricanAlaska NativeAlaskan AthabascanAlbanianAleutAlsatianAmericanApacheArabArapahoArgentineanArmenianAssyrian/Chaldean/SyriacAustralianAustrianBahamianBangladeshiBarbadianBasqueBelgianBelizeanBermudanBhutaneseBlackfeetBolivianBrazilianBritishBritish West IndianBulgarianBurmeseCajunCambodianCanadianCape VerdeanCelticCentral AmericanCentral American IndianCherokeeCheyenneChickasawChileanChineseChippewaChoctawColombianColvilleComancheCosta RicanCreeCreekCroatianCrowCubanCypriotCzechCzechoslovakianDanishDelawareDominicanDutchDutch West IndianEastern EuropeanEcuadorianEgyptianEnglishEstonianEthiopianEuropeanFijianFilipinoFinnishFrenchFrench American IndianFrench CanadianGermanGerman RussianGhanaianGreekGuamanian/ChamorroGuatemalanGuyaneseHaitianHmongHonduranHopiHoumaHungarianIcelanderIndian (Asian)IndonesianInupiatIranianIraqiIrishIroquoisIsraeliItalianJamaicanJapaneseJordanianKenyanKiowaKoreanLaotianLatvianLebaneseLiberianLithuanianLumbeeLuxembourgerMacedonianMalaysianMalteseMarshalleseMenomineeMexicanMexican American IndianMongolianMoroccanNative HawaiianNavajoNepaleseNew ZealanderNicaraguanNigerianNorthern EuropeanNorwegianOkinawanOsageOttawaPaiutePakistaniPalestinianPanamanianParaguayanPennsylvania GermanPeruvianPimaPolishPortuguesePotawatomiPuebloPuerto RicanPuget Sound SalishRomanianRussianSalvadoranSamoanScandinavianScotch-IrishScottishSeminoleSenegaleseSerbianShoshoneSierra LeoneanSiouxSlavicSlovakSloveneSomaliSouth AfricanSouth AmericanSouth American IndianSoviet UnionSpaniardSpanishSpanish AmericanSpanish American IndianSri LankanSubsaharan AfricanSudaneseSwedishSwissSyrianTaiwaneseThaiTlingit-HaidaTohono O'OdhamTonganTrinidadian and TobagonianTsimshianTurkishU.S. Virgin IslanderUgandanUkrainianUruguayanUteVenezuelanVietnameseWelshWest IndianYakamaYaquiYugoslavianYumanYup'ikZimbabwean
Immigration
NonimmigrantsImmigrantsAfghanistanAfricaAlbaniaArgentinaArmeniaAsiaAustraliaAustriaBahamasBangladeshBarbadosBelarusBelgiumBelizeBoliviaBosnia and HerzegovinaBrazilBulgariaBurma/MyanmarCabo VerdeCambodiaCameroonCanadaCaribbeanCentral AmericaChileChinaColombiaCongoCosta RicaCroatiaCubaCzechoslovakiaDenmarkDominicaDominican RepublicEastern AfricaEastern AsiaEastern EuropeEcuadorEgyptEl SalvadorEnglandEritreaEthiopiaEuropeFijiFranceGermanyGhanaGreeceGrenadaGuatemalaGuyanaHaitiHondurasHong KongHungaryIndiaIndonesiaIranIraqIrelandIsraelItalyJamaicaJapanJordanKazakhstanKenyaKoreaKuwaitLaosLatin AmericaLatviaLebanonLiberiaLithuaniaMalaysiaMexicoMicronesiaMiddle AfricaMoldovaMoroccoNepalNetherlandsNicaraguaNigeriaNorth AmericaNorth MacedoniaNorthern AfricaNorthern EuropeNorwayOceaniaPakistanPanamaPeruPhilippinesPolandPortugalRomaniaRussiaSaudi ArabiaScotlandSenegalSerbiaSierra LeoneSingaporeSomaliaSouth AfricaSouth AmericaSouth Central AsiaSouth Eastern AsiaSouthern EuropeSpainSri LankaSt. Vincent and the GrenadinesSudanSwedenSwitzerlandSyriaTaiwanThailandTrinidad and TobagoTurkeyUgandaUkraineUruguayUzbekistanVenezuelaVietnamWest IndiesWestern AfricaWestern AsiaWestern EuropeYemenZaireZimbabweAzores
Unemployment Among Ages 20 to 24 years
Income
Poverty
Unemployment
Labor Participation
Family Structure
Vehicle Availability
Education Level
Disability

Unemployment Among Ages 20 to 24 years Comparison

Carpatho Rusyns

Immigrants from Belize

Exceptional
Tragic
9.8%
UNEMPLOYMENT AMONG AGES 20 TO 24 YEARS
99.6/ 100
METRIC RATING
55th/ 347
METRIC RANK
12.0%
UNEMPLOYMENT AMONG AGES 20 TO 24 YEARS
0.0/ 100
METRIC RATING
294th/ 347
METRIC RANK

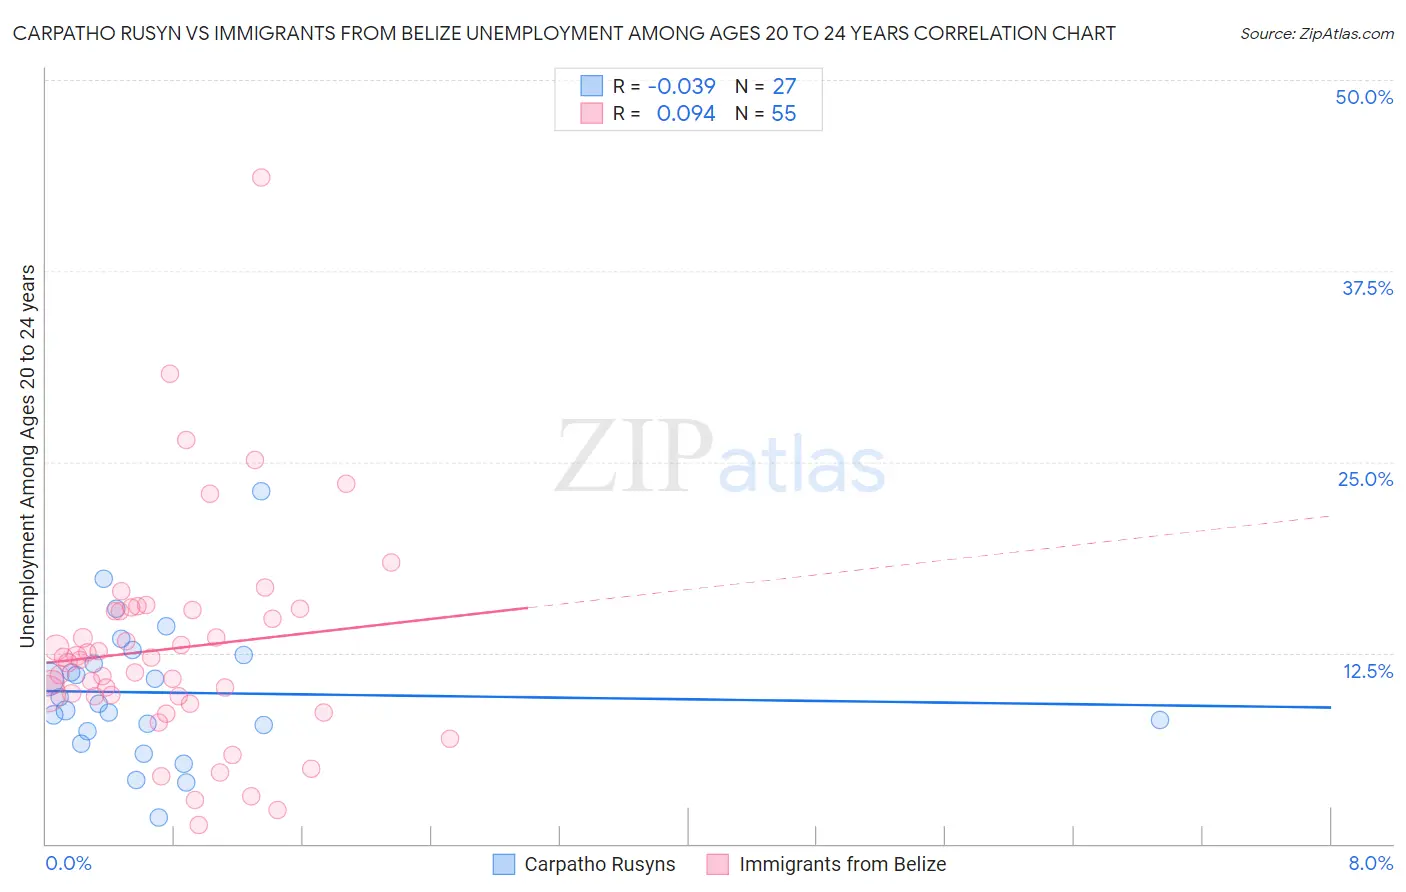
Carpatho Rusyn vs Immigrants from Belize Unemployment Among Ages 20 to 24 years Correlation Chart

The statistical analysis conducted on geographies consisting of 58,204,618 people shows no correlation between the proportion of Carpatho Rusyns and unemployment rate among population between the ages 20 and 24 in the United States with a correlation coefficient (R) of -0.039 and weighted average of 9.8%. Similarly, the statistical analysis conducted on geographies consisting of 129,412,636 people shows a slight positive correlation between the proportion of Immigrants from Belize and unemployment rate among population between the ages 20 and 24 in the United States with a correlation coefficient (R) of 0.094 and weighted average of 12.0%, a difference of 22.1%.
Carpatho Rusyn vs Immigrants from Belize Unemployment Among Ages 20 to 24 years

Unemployment Among Ages 20 to 24 years Correlation Summary

MeasurementCarpatho RusynImmigrants from Belize
Minimum1.7%1.2%
Maximum23.1%43.6%
Range21.4%42.4%
Mean9.9%12.8%
Median9.2%12.0%
Interquartile 25% (IQ1)7.3%9.6%
Interquartile 75% (IQ3)12.3%15.3%
Interquartile Range (IQR)5.0%5.7%
Standard Deviation (Sample)4.5%7.2%
Standard Deviation (Population)4.4%7.2%

Similar Demographics by Unemployment Among Ages 20 to 24 years

Demographics Similar to Carpatho Rusyns by Unemployment Among Ages 20 to 24 years

In terms of unemployment among ages 20 to 24 years, the demographic groups most similar to Carpatho Rusyns are Nicaraguan (9.8%, a difference of 0.010%), Immigrants from Cambodia (9.8%, a difference of 0.13%), Immigrants from Serbia (9.8%, a difference of 0.16%), Immigrants from Moldova (9.8%, a difference of 0.16%), and Pakistani (9.8%, a difference of 0.20%).
DemographicsRating | RankUnemployment Among Ages 20 to 24 years
Finns
99.8
/100
|
#48
Exceptional
9.7%
Creek
99.8
/100
|
#49
Exceptional
9.7%
Immigrants | Kenya
99.7
/100
|
#50
Exceptional
9.7%
Ethiopians
99.7
/100
|
#51
Exceptional
9.8%
Immigrants | Thailand
99.7
/100
|
#52
Exceptional
9.8%
Immigrants | Serbia
99.6
/100
|
#53
Exceptional
9.8%
Immigrants | Cambodia
99.6
/100
|
#54
Exceptional
9.8%
Carpatho Rusyns
99.6
/100
|
#55
Exceptional
9.8%
Nicaraguans
99.6
/100
|
#56
Exceptional
9.8%
Immigrants | Moldova
99.5
/100
|
#57
Exceptional
9.8%
Pakistanis
99.5
/100
|
#58
Exceptional
9.8%
English
99.5
/100
|
#59
Exceptional
9.8%
Immigrants | Kuwait
99.5
/100
|
#60
Exceptional
9.8%
Malaysians
99.5
/100
|
#61
Exceptional
9.8%
Immigrants | Singapore
99.4
/100
|
#62
Exceptional
9.8%

Demographics Similar to Immigrants from Belize by Unemployment Among Ages 20 to 24 years

In terms of unemployment among ages 20 to 24 years, the demographic groups most similar to Immigrants from Belize are Immigrants from Ghana (11.9%, a difference of 0.030%), Immigrants from Armenia (12.0%, a difference of 0.18%), Cajun (12.0%, a difference of 0.21%), Blackfeet (12.0%, a difference of 0.22%), and Immigrants from Senegal (11.9%, a difference of 0.26%).
DemographicsRating | RankUnemployment Among Ages 20 to 24 years
Immigrants | Ecuador
0.0
/100
|
#287
Tragic
11.8%
U.S. Virgin Islanders
0.0
/100
|
#288
Tragic
11.8%
Belizeans
0.0
/100
|
#289
Tragic
11.8%
Immigrants | Caribbean
0.0
/100
|
#290
Tragic
11.8%
Central American Indians
0.0
/100
|
#291
Tragic
11.9%
Immigrants | Senegal
0.0
/100
|
#292
Tragic
11.9%
Immigrants | Ghana
0.0
/100
|
#293
Tragic
11.9%
Immigrants | Belize
0.0
/100
|
#294
Tragic
12.0%
Immigrants | Armenia
0.0
/100
|
#295
Tragic
12.0%
Cajuns
0.0
/100
|
#296
Tragic
12.0%
Blackfeet
0.0
/100
|
#297
Tragic
12.0%
Lumbee
0.0
/100
|
#298
Tragic
12.0%
Apache
0.0
/100
|
#299
Tragic
12.0%
Spanish American Indians
0.0
/100
|
#300
Tragic
12.1%
Immigrants | Sierra Leone
0.0
/100
|
#301
Tragic
12.1%