Immigrants from Cameroon vs Immigrants from Laos Unemployment Among Ages 55 to 59 years
COMPARE
Immigrants from Cameroon
Immigrants from Laos
Unemployment Among Ages 55 to 59 years
Unemployment Among Ages 55 to 59 years Comparison
Immigrants from Cameroon
Immigrants from Laos
4.7%
UNEMPLOYMENT AMONG AGES 55 TO 59 YEARS
96.9/ 100
METRIC RATING
88th/ 347
METRIC RANK
4.7%
UNEMPLOYMENT AMONG AGES 55 TO 59 YEARS
93.9/ 100
METRIC RATING
106th/ 347
METRIC RANK
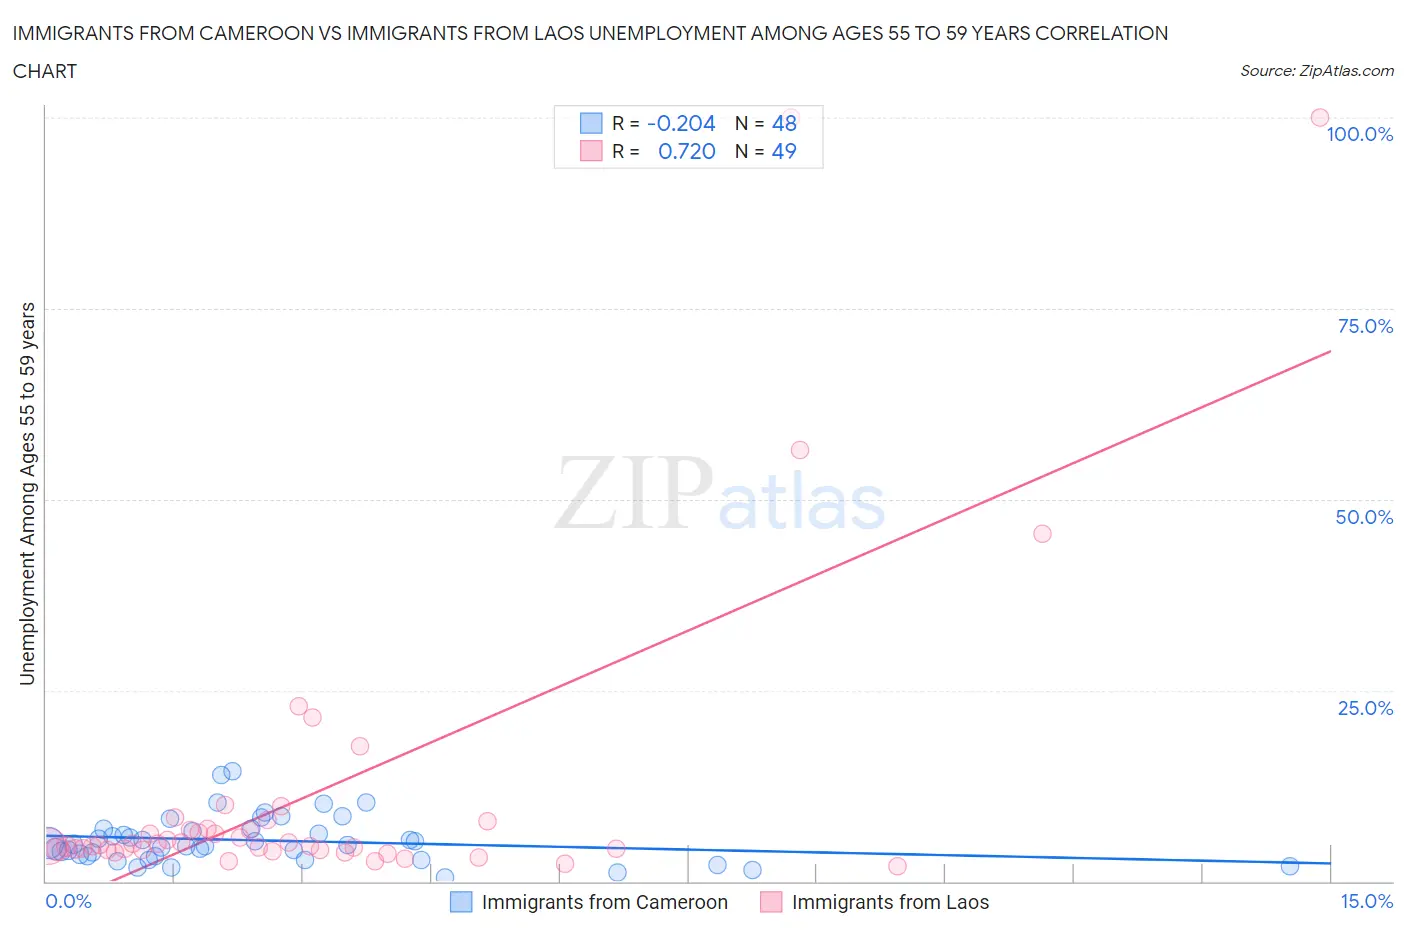
Immigrants from Cameroon vs Immigrants from Laos Unemployment Among Ages 55 to 59 years Correlation Chart
The statistical analysis conducted on geographies consisting of 127,565,038 people shows a weak negative correlation between the proportion of Immigrants from Cameroon and unemployment rate among population between the ages 55 and 59 in the United States with a correlation coefficient (R) of -0.204 and weighted average of 4.7%. Similarly, the statistical analysis conducted on geographies consisting of 193,806,599 people shows a strong positive correlation between the proportion of Immigrants from Laos and unemployment rate among population between the ages 55 and 59 in the United States with a correlation coefficient (R) of 0.720 and weighted average of 4.7%, a difference of 0.74%.
Unemployment Among Ages 55 to 59 years Correlation Summary
| Measurement | Immigrants from Cameroon | Immigrants from Laos |
| Minimum | 0.50% | 2.0% |
| Maximum | 14.4% | 100.0% |
| Range | 13.9% | 98.0% |
| Mean | 5.3% | 11.7% |
| Median | 4.8% | 4.7% |
| Interquartile 25% (IQ1) | 3.3% | 4.1% |
| Interquartile 75% (IQ3) | 6.6% | 7.4% |
| Interquartile Range (IQR) | 3.4% | 3.2% |
| Standard Deviation (Sample) | 3.1% | 20.9% |
| Standard Deviation (Population) | 3.0% | 20.7% |
Demographics Similar to Immigrants from Cameroon and Immigrants from Laos by Unemployment Among Ages 55 to 59 years
In terms of unemployment among ages 55 to 59 years, the demographic groups most similar to Immigrants from Cameroon are Polish (4.7%, a difference of 0.0%), Irish (4.7%, a difference of 0.020%), Immigrants from Poland (4.7%, a difference of 0.15%), New Zealander (4.7%, a difference of 0.17%), and Iraqi (4.7%, a difference of 0.25%). Similarly, the demographic groups most similar to Immigrants from Laos are Immigrants from North America (4.7%, a difference of 0.010%), Immigrants from Turkey (4.7%, a difference of 0.020%), Canadian (4.7%, a difference of 0.040%), Immigrants from Oceania (4.7%, a difference of 0.040%), and Immigrants from Egypt (4.7%, a difference of 0.060%).
| Demographics | Rating | Rank | Unemployment Among Ages 55 to 59 years |
| Poles | 96.9 /100 | #87 | Exceptional 4.7% |
| Immigrants | Cameroon | 96.9 /100 | #88 | Exceptional 4.7% |
| Irish | 96.8 /100 | #89 | Exceptional 4.7% |
| Immigrants | Poland | 96.4 /100 | #90 | Exceptional 4.7% |
| New Zealanders | 96.3 /100 | #91 | Exceptional 4.7% |
| Iraqis | 96.1 /100 | #92 | Exceptional 4.7% |
| Immigrants | England | 95.8 /100 | #93 | Exceptional 4.7% |
| Immigrants | Scotland | 95.7 /100 | #94 | Exceptional 4.7% |
| South Africans | 95.6 /100 | #95 | Exceptional 4.7% |
| Immigrants | Belgium | 95.0 /100 | #96 | Exceptional 4.7% |
| Immigrants | Canada | 94.9 /100 | #97 | Exceptional 4.7% |
| Immigrants | Germany | 94.8 /100 | #98 | Exceptional 4.7% |
| Yugoslavians | 94.7 /100 | #99 | Exceptional 4.7% |
| Serbians | 94.4 /100 | #100 | Exceptional 4.7% |
| Celtics | 94.3 /100 | #101 | Exceptional 4.7% |
| Canadians | 94.1 /100 | #102 | Exceptional 4.7% |
| Immigrants | Oceania | 94.0 /100 | #103 | Exceptional 4.7% |
| Immigrants | Turkey | 93.9 /100 | #104 | Exceptional 4.7% |
| Immigrants | North America | 93.9 /100 | #105 | Exceptional 4.7% |
| Immigrants | Laos | 93.9 /100 | #106 | Exceptional 4.7% |
| Immigrants | Egypt | 93.5 /100 | #107 | Exceptional 4.7% |