Immigrants from Cameroon vs Immigrants from the Azores Unemployment Among Ages 55 to 59 years
COMPARE
Immigrants from Cameroon
Immigrants from the Azores
Unemployment Among Ages 55 to 59 years
Unemployment Among Ages 55 to 59 years Comparison
Immigrants from Cameroon
Immigrants from the Azores
4.7%
UNEMPLOYMENT AMONG AGES 55 TO 59 YEARS
96.9/ 100
METRIC RATING
88th/ 347
METRIC RANK
5.8%
UNEMPLOYMENT AMONG AGES 55 TO 59 YEARS
0.0/ 100
METRIC RATING
320th/ 347
METRIC RANK
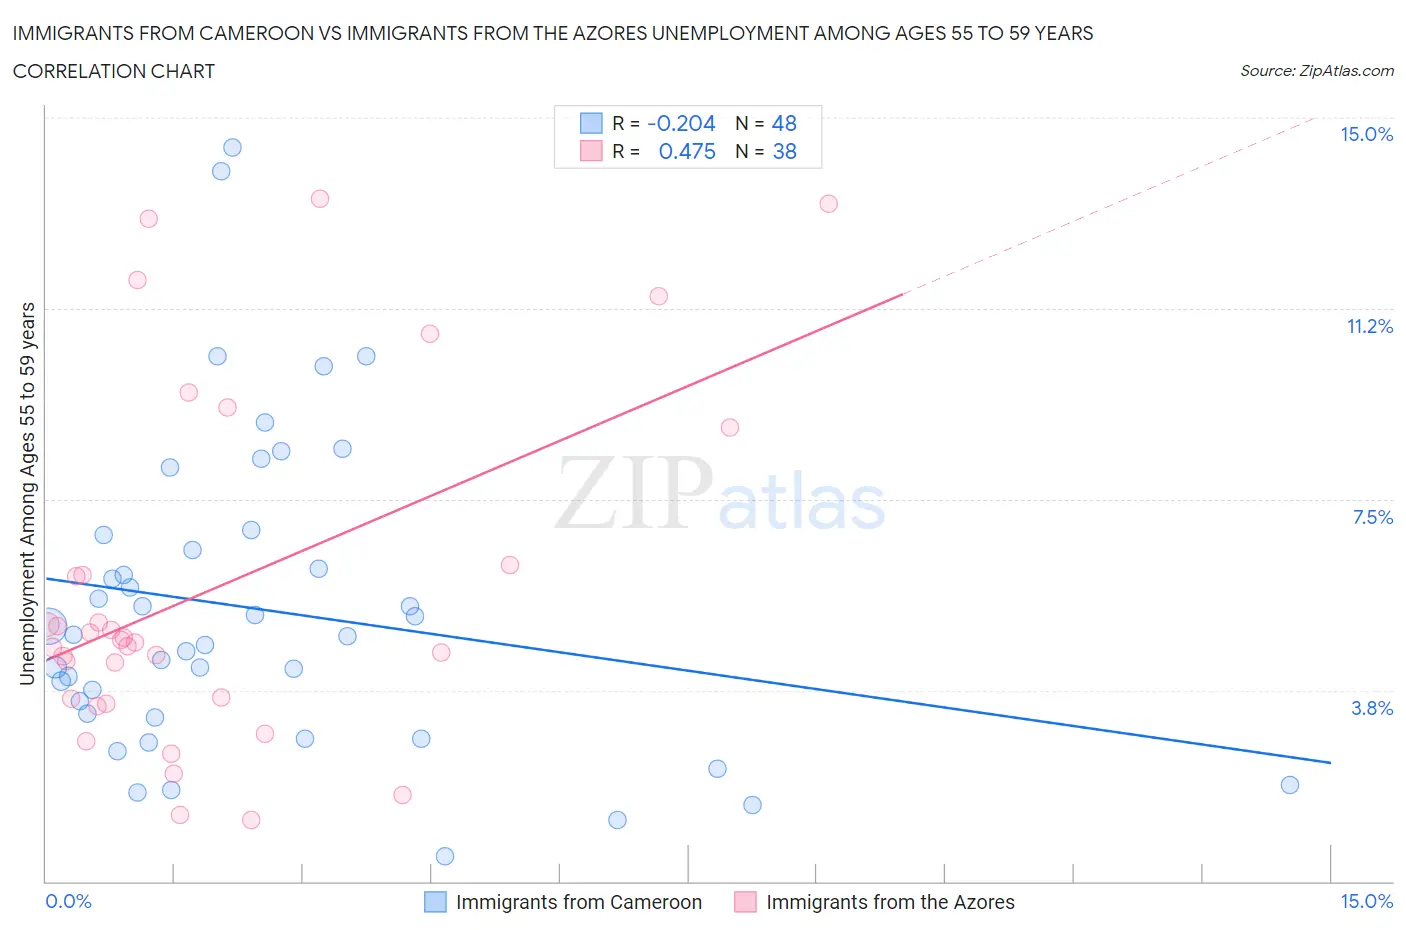
Immigrants from Cameroon vs Immigrants from the Azores Unemployment Among Ages 55 to 59 years Correlation Chart
The statistical analysis conducted on geographies consisting of 127,565,038 people shows a weak negative correlation between the proportion of Immigrants from Cameroon and unemployment rate among population between the ages 55 and 59 in the United States with a correlation coefficient (R) of -0.204 and weighted average of 4.7%. Similarly, the statistical analysis conducted on geographies consisting of 45,193,942 people shows a moderate positive correlation between the proportion of Immigrants from the Azores and unemployment rate among population between the ages 55 and 59 in the United States with a correlation coefficient (R) of 0.475 and weighted average of 5.8%, a difference of 23.9%.
Unemployment Among Ages 55 to 59 years Correlation Summary
| Measurement | Immigrants from Cameroon | Immigrants from the Azores |
| Minimum | 0.50% | 1.2% |
| Maximum | 14.4% | 13.4% |
| Range | 13.9% | 12.2% |
| Mean | 5.3% | 5.8% |
| Median | 4.8% | 4.7% |
| Interquartile 25% (IQ1) | 3.3% | 3.6% |
| Interquartile 75% (IQ3) | 6.6% | 6.2% |
| Interquartile Range (IQR) | 3.4% | 2.6% |
| Standard Deviation (Sample) | 3.1% | 3.4% |
| Standard Deviation (Population) | 3.0% | 3.4% |
Similar Demographics by Unemployment Among Ages 55 to 59 years
Demographics Similar to Immigrants from Cameroon by Unemployment Among Ages 55 to 59 years
In terms of unemployment among ages 55 to 59 years, the demographic groups most similar to Immigrants from Cameroon are Polish (4.7%, a difference of 0.0%), Immigrants from Colombia (4.7%, a difference of 0.020%), Irish (4.7%, a difference of 0.020%), Malaysian (4.7%, a difference of 0.030%), and Immigrants from Vietnam (4.7%, a difference of 0.030%).
| Demographics | Rating | Rank | Unemployment Among Ages 55 to 59 years |
| Taiwanese | 97.9 /100 | #81 | Exceptional 4.6% |
| Latvians | 97.8 /100 | #82 | Exceptional 4.6% |
| Lebanese | 97.5 /100 | #83 | Exceptional 4.6% |
| Malaysians | 96.9 /100 | #84 | Exceptional 4.7% |
| Immigrants | Vietnam | 96.9 /100 | #85 | Exceptional 4.7% |
| Immigrants | Colombia | 96.9 /100 | #86 | Exceptional 4.7% |
| Poles | 96.9 /100 | #87 | Exceptional 4.7% |
| Immigrants | Cameroon | 96.9 /100 | #88 | Exceptional 4.7% |
| Irish | 96.8 /100 | #89 | Exceptional 4.7% |
| Immigrants | Poland | 96.4 /100 | #90 | Exceptional 4.7% |
| New Zealanders | 96.3 /100 | #91 | Exceptional 4.7% |
| Iraqis | 96.1 /100 | #92 | Exceptional 4.7% |
| Immigrants | England | 95.8 /100 | #93 | Exceptional 4.7% |
| Immigrants | Scotland | 95.7 /100 | #94 | Exceptional 4.7% |
| South Africans | 95.6 /100 | #95 | Exceptional 4.7% |
Demographics Similar to Immigrants from the Azores by Unemployment Among Ages 55 to 59 years
In terms of unemployment among ages 55 to 59 years, the demographic groups most similar to Immigrants from the Azores are Kiowa (5.8%, a difference of 0.26%), Immigrants from Guyana (5.8%, a difference of 0.27%), Hmong (5.7%, a difference of 1.2%), Immigrants from Ecuador (5.7%, a difference of 1.4%), and Guyanese (5.7%, a difference of 1.6%).
| Demographics | Rating | Rank | Unemployment Among Ages 55 to 59 years |
| Central American Indians | 0.0 /100 | #313 | Tragic 5.6% |
| Tlingit-Haida | 0.0 /100 | #314 | Tragic 5.7% |
| Guyanese | 0.0 /100 | #315 | Tragic 5.7% |
| Immigrants | Ecuador | 0.0 /100 | #316 | Tragic 5.7% |
| Hmong | 0.0 /100 | #317 | Tragic 5.7% |
| Immigrants | Guyana | 0.0 /100 | #318 | Tragic 5.8% |
| Kiowa | 0.0 /100 | #319 | Tragic 5.8% |
| Immigrants | Azores | 0.0 /100 | #320 | Tragic 5.8% |
| Chippewa | 0.0 /100 | #321 | Tragic 5.9% |
| Crow | 0.0 /100 | #322 | Tragic 5.9% |
| Immigrants | Bangladesh | 0.0 /100 | #323 | Tragic 5.9% |
| Vietnamese | 0.0 /100 | #324 | Tragic 5.9% |
| Immigrants | Armenia | 0.0 /100 | #325 | Tragic 6.0% |
| Natives/Alaskans | 0.0 /100 | #326 | Tragic 6.0% |
| Arapaho | 0.0 /100 | #327 | Tragic 6.1% |