French Canadian vs Immigrants from Laos Unemployment Among Ages 55 to 59 years
COMPARE
French Canadian
Immigrants from Laos
Unemployment Among Ages 55 to 59 years
Unemployment Among Ages 55 to 59 years Comparison
French Canadians
Immigrants from Laos
4.8%
UNEMPLOYMENT AMONG AGES 55 TO 59 YEARS
80.1/ 100
METRIC RATING
141st/ 347
METRIC RANK
4.7%
UNEMPLOYMENT AMONG AGES 55 TO 59 YEARS
93.9/ 100
METRIC RATING
106th/ 347
METRIC RANK
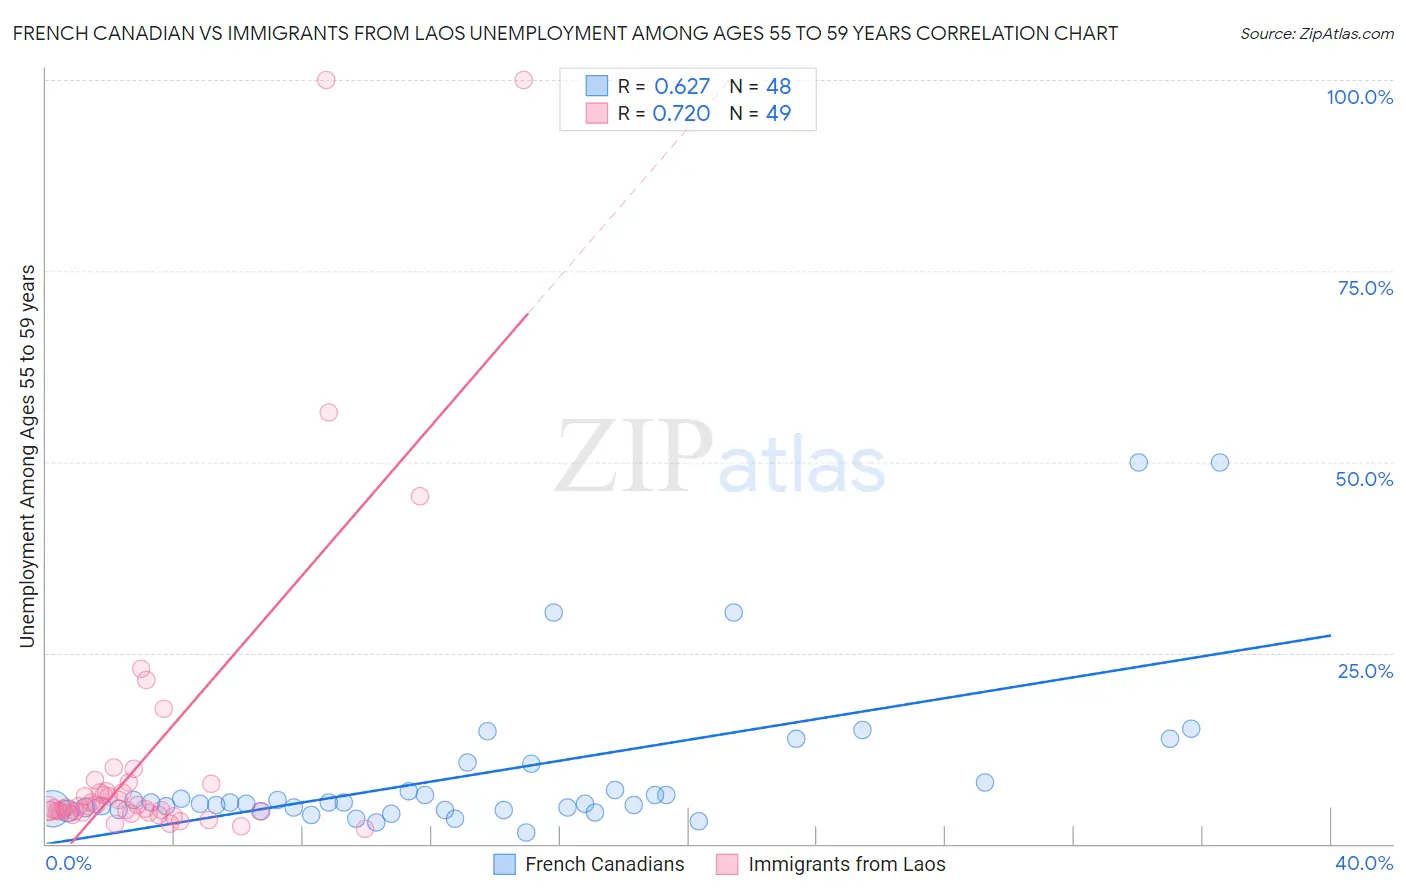
French Canadian vs Immigrants from Laos Unemployment Among Ages 55 to 59 years Correlation Chart
The statistical analysis conducted on geographies consisting of 444,972,428 people shows a significant positive correlation between the proportion of French Canadians and unemployment rate among population between the ages 55 and 59 in the United States with a correlation coefficient (R) of 0.627 and weighted average of 4.8%. Similarly, the statistical analysis conducted on geographies consisting of 193,806,599 people shows a strong positive correlation between the proportion of Immigrants from Laos and unemployment rate among population between the ages 55 and 59 in the United States with a correlation coefficient (R) of 0.720 and weighted average of 4.7%, a difference of 1.4%.
Unemployment Among Ages 55 to 59 years Correlation Summary
| Measurement | French Canadian | Immigrants from Laos |
| Minimum | 1.5% | 2.0% |
| Maximum | 50.0% | 100.0% |
| Range | 48.5% | 98.0% |
| Mean | 9.1% | 11.7% |
| Median | 5.3% | 4.7% |
| Interquartile 25% (IQ1) | 4.5% | 4.1% |
| Interquartile 75% (IQ3) | 7.5% | 7.4% |
| Interquartile Range (IQR) | 3.0% | 3.2% |
| Standard Deviation (Sample) | 10.4% | 20.9% |
| Standard Deviation (Population) | 10.3% | 20.7% |
Similar Demographics by Unemployment Among Ages 55 to 59 years
Demographics Similar to French Canadians by Unemployment Among Ages 55 to 59 years
In terms of unemployment among ages 55 to 59 years, the demographic groups most similar to French Canadians are Immigrants from Indonesia (4.8%, a difference of 0.010%), Immigrants from Norway (4.8%, a difference of 0.020%), Ukrainian (4.8%, a difference of 0.090%), Immigrants from Asia (4.8%, a difference of 0.14%), and Immigrants from Northern Europe (4.8%, a difference of 0.16%).
| Demographics | Rating | Rank | Unemployment Among Ages 55 to 59 years |
| Panamanians | 84.1 /100 | #134 | Excellent 4.7% |
| Slavs | 83.7 /100 | #135 | Excellent 4.7% |
| Colombians | 83.6 /100 | #136 | Excellent 4.7% |
| Delaware | 83.6 /100 | #137 | Excellent 4.7% |
| Immigrants | Switzerland | 82.9 /100 | #138 | Excellent 4.7% |
| Romanians | 82.7 /100 | #139 | Excellent 4.7% |
| Immigrants | Indonesia | 80.2 /100 | #140 | Excellent 4.8% |
| French Canadians | 80.1 /100 | #141 | Excellent 4.8% |
| Immigrants | Norway | 79.8 /100 | #142 | Good 4.8% |
| Ukrainians | 78.6 /100 | #143 | Good 4.8% |
| Immigrants | Asia | 77.8 /100 | #144 | Good 4.8% |
| Immigrants | Northern Europe | 77.5 /100 | #145 | Good 4.8% |
| Immigrants | South Eastern Asia | 77.4 /100 | #146 | Good 4.8% |
| Immigrants | Singapore | 76.6 /100 | #147 | Good 4.8% |
| Immigrants | Bahamas | 71.8 /100 | #148 | Good 4.8% |
Demographics Similar to Immigrants from Laos by Unemployment Among Ages 55 to 59 years
In terms of unemployment among ages 55 to 59 years, the demographic groups most similar to Immigrants from Laos are Immigrants from North America (4.7%, a difference of 0.010%), Immigrants from Turkey (4.7%, a difference of 0.020%), Canadian (4.7%, a difference of 0.040%), Immigrants from Oceania (4.7%, a difference of 0.040%), and Immigrants from Egypt (4.7%, a difference of 0.060%).
| Demographics | Rating | Rank | Unemployment Among Ages 55 to 59 years |
| Yugoslavians | 94.7 /100 | #99 | Exceptional 4.7% |
| Serbians | 94.4 /100 | #100 | Exceptional 4.7% |
| Celtics | 94.3 /100 | #101 | Exceptional 4.7% |
| Canadians | 94.1 /100 | #102 | Exceptional 4.7% |
| Immigrants | Oceania | 94.0 /100 | #103 | Exceptional 4.7% |
| Immigrants | Turkey | 93.9 /100 | #104 | Exceptional 4.7% |
| Immigrants | North America | 93.9 /100 | #105 | Exceptional 4.7% |
| Immigrants | Laos | 93.9 /100 | #106 | Exceptional 4.7% |
| Immigrants | Egypt | 93.5 /100 | #107 | Exceptional 4.7% |
| French | 93.3 /100 | #108 | Exceptional 4.7% |
| Chileans | 93.2 /100 | #109 | Exceptional 4.7% |
| Egyptians | 92.9 /100 | #110 | Exceptional 4.7% |
| Austrians | 92.4 /100 | #111 | Exceptional 4.7% |
| Afghans | 92.1 /100 | #112 | Exceptional 4.7% |
| Immigrants | Spain | 91.4 /100 | #113 | Exceptional 4.7% |