Immigrants from Cameroon vs Arab Unemployment Among Seniors over 65 years
COMPARE
Immigrants from Cameroon
Arab
Unemployment Among Seniors over 65 years
Unemployment Among Seniors over 65 years Comparison
Immigrants from Cameroon
Arabs
5.1%
UNEMPLOYMENT AMONG SENIORS OVER 65 YEARS
88.6/ 100
METRIC RATING
122nd/ 347
METRIC RANK
5.1%
UNEMPLOYMENT AMONG SENIORS OVER 65 YEARS
84.3/ 100
METRIC RATING
137th/ 347
METRIC RANK
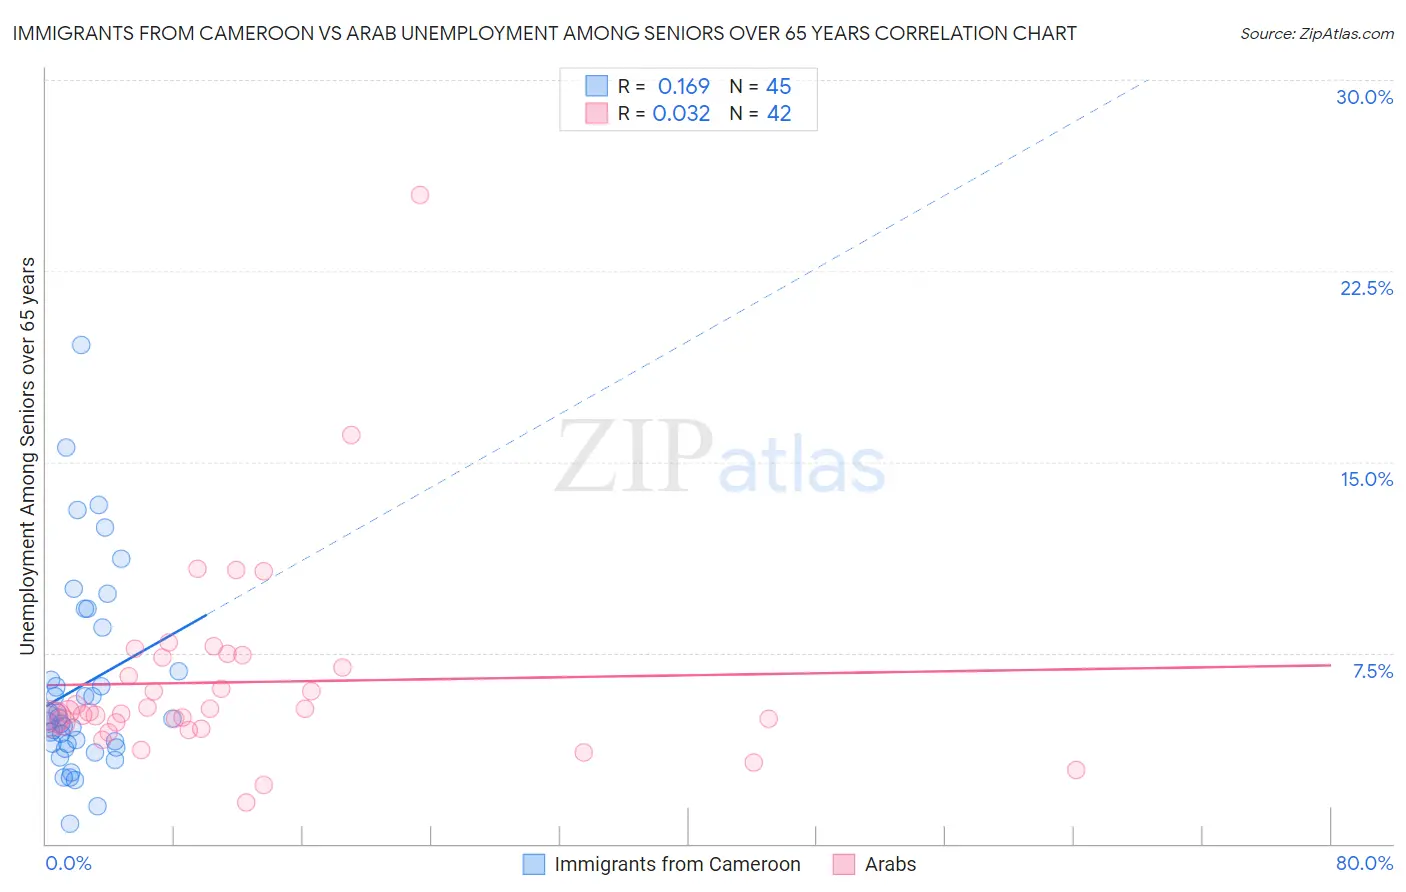
Immigrants from Cameroon vs Arab Unemployment Among Seniors over 65 years Correlation Chart
The statistical analysis conducted on geographies consisting of 125,322,101 people shows a poor positive correlation between the proportion of Immigrants from Cameroon and unemployment rate amomg seniors over the age of 65 in the United States with a correlation coefficient (R) of 0.169 and weighted average of 5.1%. Similarly, the statistical analysis conducted on geographies consisting of 424,548,870 people shows no correlation between the proportion of Arabs and unemployment rate amomg seniors over the age of 65 in the United States with a correlation coefficient (R) of 0.032 and weighted average of 5.1%, a difference of 0.30%.
Unemployment Among Seniors over 65 years Correlation Summary
| Measurement | Immigrants from Cameroon | Arab |
| Minimum | 0.80% | 1.6% |
| Maximum | 19.6% | 25.5% |
| Range | 18.8% | 23.9% |
| Mean | 6.2% | 6.3% |
| Median | 4.9% | 5.2% |
| Interquartile 25% (IQ1) | 3.9% | 4.7% |
| Interquartile 75% (IQ3) | 7.6% | 7.3% |
| Interquartile Range (IQR) | 3.8% | 2.6% |
| Standard Deviation (Sample) | 3.9% | 4.0% |
| Standard Deviation (Population) | 3.8% | 3.9% |
Demographics Similar to Immigrants from Cameroon and Arabs by Unemployment Among Seniors over 65 years
In terms of unemployment among seniors over 65 years, the demographic groups most similar to Immigrants from Cameroon are Asian (5.1%, a difference of 0.0%), Puget Sound Salish (5.1%, a difference of 0.010%), Irish (5.1%, a difference of 0.020%), Immigrants from North America (5.1%, a difference of 0.050%), and Dutch (5.1%, a difference of 0.070%). Similarly, the demographic groups most similar to Arabs are White/Caucasian (5.1%, a difference of 0.0%), Ukrainian (5.1%, a difference of 0.010%), Turkish (5.1%, a difference of 0.030%), Syrian (5.1%, a difference of 0.060%), and New Zealander (5.1%, a difference of 0.060%).
| Demographics | Rating | Rank | Unemployment Among Seniors over 65 years |
| Immigrants | Canada | 89.7 /100 | #119 | Excellent 5.1% |
| Irish | 88.8 /100 | #120 | Excellent 5.1% |
| Puget Sound Salish | 88.7 /100 | #121 | Excellent 5.1% |
| Immigrants | Cameroon | 88.6 /100 | #122 | Excellent 5.1% |
| Asians | 88.5 /100 | #123 | Excellent 5.1% |
| Immigrants | North America | 87.9 /100 | #124 | Excellent 5.1% |
| Dutch | 87.6 /100 | #125 | Excellent 5.1% |
| Immigrants | Sri Lanka | 87.4 /100 | #126 | Excellent 5.1% |
| Sri Lankans | 87.4 /100 | #127 | Excellent 5.1% |
| Australians | 87.1 /100 | #128 | Excellent 5.1% |
| Immigrants | England | 86.7 /100 | #129 | Excellent 5.1% |
| Iranians | 86.6 /100 | #130 | Excellent 5.1% |
| Immigrants | Australia | 85.8 /100 | #131 | Excellent 5.1% |
| Chileans | 85.6 /100 | #132 | Excellent 5.1% |
| Syrians | 85.3 /100 | #133 | Excellent 5.1% |
| Turks | 84.9 /100 | #134 | Excellent 5.1% |
| Ukrainians | 84.4 /100 | #135 | Excellent 5.1% |
| Whites/Caucasians | 84.4 /100 | #136 | Excellent 5.1% |
| Arabs | 84.3 /100 | #137 | Excellent 5.1% |
| New Zealanders | 83.2 /100 | #138 | Excellent 5.1% |
| Immigrants | Panama | 83.0 /100 | #139 | Excellent 5.1% |