Immigrants from Cambodia vs Immigrants from Croatia Unemployment Among Ages 45 to 54 years

COMPARE

Immigrants from Cambodia
Race
Ancestry
AfghanAfricanAlaska NativeAlaskan AthabascanAlbanianAleutAlsatianAmericanApacheArabArapahoArgentineanArmenianAssyrian/Chaldean/SyriacAustralianAustrianBahamianBangladeshiBarbadianBasqueBelgianBelizeanBermudanBhutaneseBlackfeetBolivianBrazilianBritishBritish West IndianBulgarianBurmeseCajunCambodianCanadianCape VerdeanCarpatho RusynCelticCentral AmericanCentral American IndianCherokeeCheyenneChickasawChileanChineseChippewaChoctawColombianColvilleComancheCosta RicanCreeCreekCroatianCrowCubanCypriotCzechCzechoslovakianDanishDelawareDominicanDutchDutch West IndianEastern EuropeanEcuadorianEgyptianEnglishEstonianEthiopianEuropeanFijianFilipinoFinnishFrenchFrench American IndianFrench CanadianGermanGerman RussianGhanaianGreekGuamanian/ChamorroGuatemalanGuyaneseHaitianHmongHonduranHopiHoumaHungarianIcelanderIndian (Asian)IndonesianInupiatIranianIraqiIrishIroquoisIsraeliItalianJamaicanJapaneseJordanianKenyanKiowaKoreanLaotianLatvianLebaneseLiberianLithuanianLumbeeLuxembourgerMacedonianMalaysianMalteseMarshalleseMenomineeMexicanMexican American IndianMongolianMoroccanNative HawaiianNavajoNepaleseNew ZealanderNicaraguanNigerianNorthern EuropeanNorwegianOkinawanOsageOttawaPaiutePakistaniPalestinianPanamanianParaguayanPennsylvania GermanPeruvianPimaPolishPortuguesePotawatomiPuebloPuerto RicanPuget Sound SalishRomanianRussianSalvadoranSamoanScandinavianScotch-IrishScottishSeminoleSenegaleseSerbianShoshoneSierra LeoneanSiouxSlavicSlovakSloveneSomaliSouth AfricanSouth AmericanSouth American IndianSoviet UnionSpaniardSpanishSpanish AmericanSpanish American IndianSri LankanSubsaharan AfricanSudaneseSwedishSwissSyrianTaiwaneseThaiTlingit-HaidaTohono O'OdhamTonganTrinidadian and TobagonianTsimshianTurkishU.S. Virgin IslanderUgandanUkrainianUruguayanUteVenezuelanVietnameseWelshWest IndianYakamaYaquiYugoslavianYumanYup'ikZimbabwean
Immigration
NonimmigrantsImmigrantsAfghanistanAfricaAlbaniaArgentinaArmeniaAsiaAustraliaAustriaBahamasBangladeshBarbadosBelarusBelgiumBelizeBoliviaBosnia and HerzegovinaBrazilBulgariaBurma/MyanmarCabo VerdeCambodiaCameroonCanadaCaribbeanCentral AmericaChileChinaColombiaCongoCosta RicaCubaCzechoslovakiaDenmarkDominicaDominican RepublicEastern AfricaEastern AsiaEastern EuropeEcuadorEgyptEl SalvadorEnglandEritreaEthiopiaEuropeFijiFranceGermanyGhanaGreeceGrenadaGuatemalaGuyanaHaitiHondurasHong KongHungaryIndiaIndonesiaIranIraqIrelandIsraelItalyJamaicaJapanJordanKazakhstanKenyaKoreaKuwaitLaosLatin AmericaLatviaLebanonLiberiaLithuaniaMalaysiaMexicoMicronesiaMiddle AfricaMoldovaMoroccoNepalNetherlandsNicaraguaNigeriaNorth AmericaNorth MacedoniaNorthern AfricaNorthern EuropeNorwayOceaniaPakistanPanamaPeruPhilippinesPolandPortugalRomaniaRussiaSaudi ArabiaScotlandSenegalSerbiaSierra LeoneSingaporeSomaliaSouth AfricaSouth AmericaSouth Central AsiaSouth Eastern AsiaSouthern EuropeSpainSri LankaSt. Vincent and the GrenadinesSudanSwedenSwitzerlandSyriaTaiwanThailandTrinidad and TobagoTurkeyUgandaUkraineUruguayUzbekistanVenezuelaVietnamWest IndiesWestern AfricaWestern AsiaWestern EuropeYemenZaireZimbabweAzores
Immigrants from Croatia
Race
Ancestry
AfghanAfricanAlaska NativeAlaskan AthabascanAlbanianAleutAlsatianAmericanApacheArabArapahoArgentineanArmenianAssyrian/Chaldean/SyriacAustralianAustrianBahamianBangladeshiBarbadianBasqueBelgianBelizeanBermudanBhutaneseBlackfeetBolivianBrazilianBritishBritish West IndianBulgarianBurmeseCajunCambodianCanadianCape VerdeanCarpatho RusynCelticCentral AmericanCentral American IndianCherokeeCheyenneChickasawChileanChineseChippewaChoctawColombianColvilleComancheCosta RicanCreeCreekCroatianCrowCubanCypriotCzechCzechoslovakianDanishDelawareDominicanDutchDutch West IndianEastern EuropeanEcuadorianEgyptianEnglishEstonianEthiopianEuropeanFijianFilipinoFinnishFrenchFrench American IndianFrench CanadianGermanGerman RussianGhanaianGreekGuamanian/ChamorroGuatemalanGuyaneseHaitianHmongHonduranHopiHoumaHungarianIcelanderIndian (Asian)IndonesianInupiatIranianIraqiIrishIroquoisIsraeliItalianJamaicanJapaneseJordanianKenyanKiowaKoreanLaotianLatvianLebaneseLiberianLithuanianLumbeeLuxembourgerMacedonianMalaysianMalteseMarshalleseMenomineeMexicanMexican American IndianMongolianMoroccanNative HawaiianNavajoNepaleseNew ZealanderNicaraguanNigerianNorthern EuropeanNorwegianOkinawanOsageOttawaPaiutePakistaniPalestinianPanamanianParaguayanPennsylvania GermanPeruvianPimaPolishPortuguesePotawatomiPuebloPuerto RicanPuget Sound SalishRomanianRussianSalvadoranSamoanScandinavianScotch-IrishScottishSeminoleSenegaleseSerbianShoshoneSierra LeoneanSiouxSlavicSlovakSloveneSomaliSouth AfricanSouth AmericanSouth American IndianSoviet UnionSpaniardSpanishSpanish AmericanSpanish American IndianSri LankanSubsaharan AfricanSudaneseSwedishSwissSyrianTaiwaneseThaiTlingit-HaidaTohono O'OdhamTonganTrinidadian and TobagonianTsimshianTurkishU.S. Virgin IslanderUgandanUkrainianUruguayanUteVenezuelanVietnameseWelshWest IndianYakamaYaquiYugoslavianYumanYup'ikZimbabwean
Immigration
NonimmigrantsImmigrantsAfghanistanAfricaAlbaniaArgentinaArmeniaAsiaAustraliaAustriaBahamasBangladeshBarbadosBelarusBelgiumBelizeBoliviaBosnia and HerzegovinaBrazilBulgariaBurma/MyanmarCabo VerdeCameroonCanadaCaribbeanCentral AmericaChileChinaColombiaCongoCosta RicaCroatiaCubaCzechoslovakiaDenmarkDominicaDominican RepublicEastern AfricaEastern AsiaEastern EuropeEcuadorEgyptEl SalvadorEnglandEritreaEthiopiaEuropeFijiFranceGermanyGhanaGreeceGrenadaGuatemalaGuyanaHaitiHondurasHong KongHungaryIndiaIndonesiaIranIraqIrelandIsraelItalyJamaicaJapanJordanKazakhstanKenyaKoreaKuwaitLaosLatin AmericaLatviaLebanonLiberiaLithuaniaMalaysiaMexicoMicronesiaMiddle AfricaMoldovaMoroccoNepalNetherlandsNicaraguaNigeriaNorth AmericaNorth MacedoniaNorthern AfricaNorthern EuropeNorwayOceaniaPakistanPanamaPeruPhilippinesPolandPortugalRomaniaRussiaSaudi ArabiaScotlandSenegalSerbiaSierra LeoneSingaporeSomaliaSouth AfricaSouth AmericaSouth Central AsiaSouth Eastern AsiaSouthern EuropeSpainSri LankaSt. Vincent and the GrenadinesSudanSwedenSwitzerlandSyriaTaiwanThailandTrinidad and TobagoTurkeyUgandaUkraineUruguayUzbekistanVenezuelaVietnamWest IndiesWestern AfricaWestern AsiaWestern EuropeYemenZaireZimbabweAzores
Unemployment Among Ages 45 to 54 years
Income
Poverty
Unemployment
Labor Participation
Family Structure
Vehicle Availability
Education Level
Disability

Unemployment Among Ages 45 to 54 years Comparison

Immigrants from Cambodia

Immigrants from Croatia

Tragic
Good
4.7%
UNEMPLOYMENT AMONG AGES 45 TO 54 YEARS
7.4/ 100
METRIC RATING
217th/ 347
METRIC RANK
4.5%
UNEMPLOYMENT AMONG AGES 45 TO 54 YEARS
69.6/ 100
METRIC RATING
156th/ 347
METRIC RANK

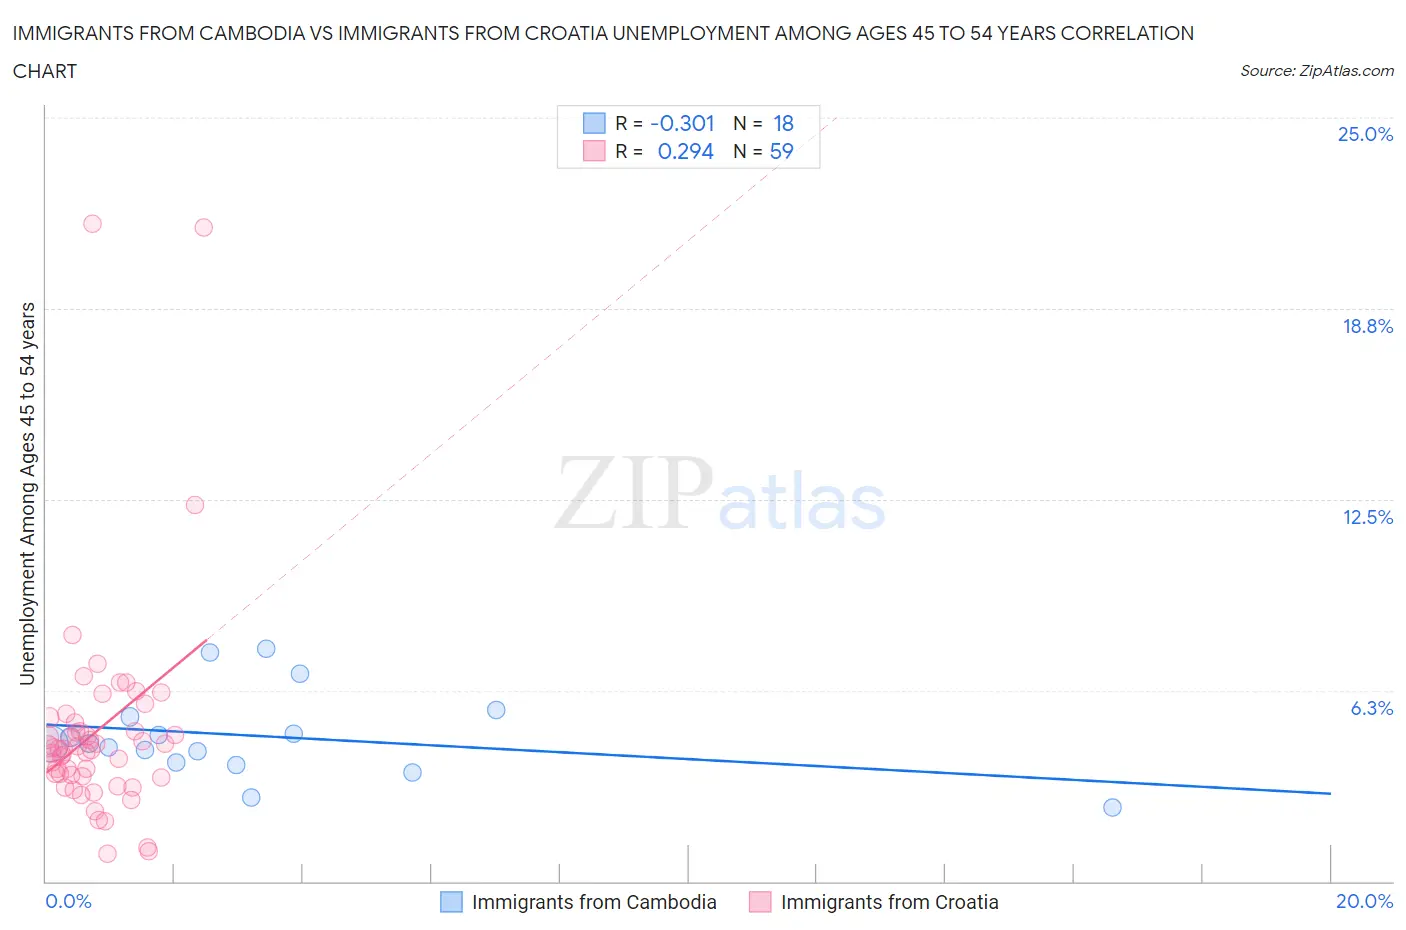
Immigrants from Cambodia vs Immigrants from Croatia Unemployment Among Ages 45 to 54 years Correlation Chart

The statistical analysis conducted on geographies consisting of 203,243,545 people shows a mild negative correlation between the proportion of Immigrants from Cambodia and unemployment rate among population between the ages 45 and 54 in the United States with a correlation coefficient (R) of -0.301 and weighted average of 4.7%. Similarly, the statistical analysis conducted on geographies consisting of 131,532,300 people shows a weak positive correlation between the proportion of Immigrants from Croatia and unemployment rate among population between the ages 45 and 54 in the United States with a correlation coefficient (R) of 0.294 and weighted average of 4.5%, a difference of 4.0%.
Immigrants from Cambodia vs Immigrants from Croatia Unemployment Among Ages 45 to 54 years

Unemployment Among Ages 45 to 54 years Correlation Summary

MeasurementImmigrants from CambodiaImmigrants from Croatia
Minimum2.4%0.90%
Maximum7.6%21.5%
Range5.2%20.6%
Mean4.8%4.9%
Median4.5%4.4%
Interquartile 25% (IQ1)3.9%3.4%
Interquartile 75% (IQ3)5.4%5.2%
Interquartile Range (IQR)1.5%1.8%
Standard Deviation (Sample)1.4%3.6%
Standard Deviation (Population)1.4%3.6%

Similar Demographics by Unemployment Among Ages 45 to 54 years

Demographics Similar to Immigrants from Cambodia by Unemployment Among Ages 45 to 54 years

In terms of unemployment among ages 45 to 54 years, the demographic groups most similar to Immigrants from Cambodia are Immigrants from Uganda (4.7%, a difference of 0.050%), Nigerian (4.7%, a difference of 0.080%), Guamanian/Chamorro (4.7%, a difference of 0.10%), Choctaw (4.7%, a difference of 0.23%), and Immigrants from Southern Europe (4.7%, a difference of 0.26%).
DemographicsRating | RankUnemployment Among Ages 45 to 54 years
Immigrants | South America
12.2
/100
|
#210
Poor
4.6%
Creek
11.9
/100
|
#211
Poor
4.6%
Immigrants | Iran
11.5
/100
|
#212
Poor
4.6%
Panamanians
10.7
/100
|
#213
Poor
4.6%
Cherokee
10.6
/100
|
#214
Poor
4.6%
Immigrants | Panama
10.4
/100
|
#215
Poor
4.6%
Lumbee
9.2
/100
|
#216
Tragic
4.6%
Immigrants | Cambodia
7.4
/100
|
#217
Tragic
4.7%
Immigrants | Uganda
7.1
/100
|
#218
Tragic
4.7%
Nigerians
7.0
/100
|
#219
Tragic
4.7%
Guamanians/Chamorros
6.8
/100
|
#220
Tragic
4.7%
Choctaw
6.1
/100
|
#221
Tragic
4.7%
Immigrants | Southern Europe
6.0
/100
|
#222
Tragic
4.7%
Potawatomi
5.7
/100
|
#223
Tragic
4.7%
Comanche
4.8
/100
|
#224
Tragic
4.7%

Demographics Similar to Immigrants from Croatia by Unemployment Among Ages 45 to 54 years

In terms of unemployment among ages 45 to 54 years, the demographic groups most similar to Immigrants from Croatia are Marshallese (4.5%, a difference of 0.060%), Indian (Asian) (4.5%, a difference of 0.080%), Immigrants from Spain (4.5%, a difference of 0.17%), Hungarian (4.5%, a difference of 0.19%), and Korean (4.5%, a difference of 0.20%).
DemographicsRating | RankUnemployment Among Ages 45 to 54 years
Costa Ricans
75.3
/100
|
#149
Good
4.5%
Tsimshian
74.6
/100
|
#150
Good
4.5%
Cypriots
74.4
/100
|
#151
Good
4.5%
Koreans
73.1
/100
|
#152
Good
4.5%
Hungarians
73.0
/100
|
#153
Good
4.5%
Immigrants | Spain
72.5
/100
|
#154
Good
4.5%
Marshallese
70.6
/100
|
#155
Good
4.5%
Immigrants | Croatia
69.6
/100
|
#156
Good
4.5%
Indians (Asian)
68.1
/100
|
#157
Good
4.5%
Immigrants | Italy
65.5
/100
|
#158
Good
4.5%
Immigrants | Nonimmigrants
62.8
/100
|
#159
Good
4.5%
Immigrants | South Eastern Asia
62.0
/100
|
#160
Good
4.5%
Immigrants | Eastern Europe
61.6
/100
|
#161
Good
4.5%
Immigrants | Indonesia
60.3
/100
|
#162
Good
4.5%
Bangladeshis
59.7
/100
|
#163
Average
4.5%