Kiowa vs English Unemployment Among Ages 25 to 29 years
COMPARE
Kiowa
English
Unemployment Among Ages 25 to 29 years
Unemployment Among Ages 25 to 29 years Comparison
Kiowa
English
7.4%
UNEMPLOYMENT AMONG AGES 25 TO 29 YEARS
0.1/ 100
METRIC RATING
263rd/ 347
METRIC RANK
6.6%
UNEMPLOYMENT AMONG AGES 25 TO 29 YEARS
58.0/ 100
METRIC RATING
165th/ 347
METRIC RANK
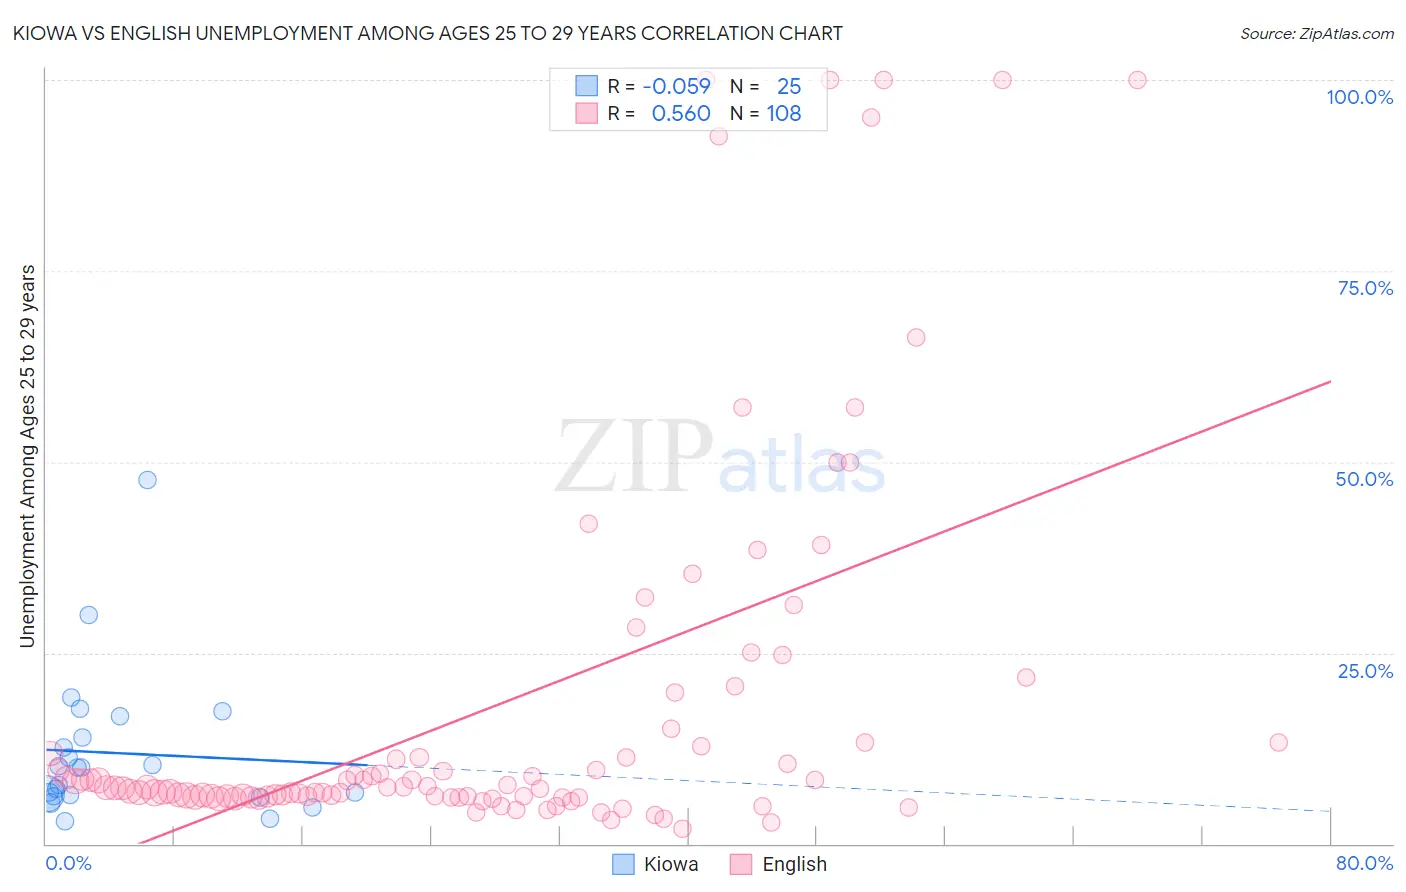
Kiowa vs English Unemployment Among Ages 25 to 29 years Correlation Chart
The statistical analysis conducted on geographies consisting of 55,447,690 people shows a slight negative correlation between the proportion of Kiowa and unemployment rate among population between the ages 25 and 29 in the United States with a correlation coefficient (R) of -0.059 and weighted average of 7.4%. Similarly, the statistical analysis conducted on geographies consisting of 509,948,748 people shows a substantial positive correlation between the proportion of English and unemployment rate among population between the ages 25 and 29 in the United States with a correlation coefficient (R) of 0.560 and weighted average of 6.6%, a difference of 11.7%.
Unemployment Among Ages 25 to 29 years Correlation Summary
| Measurement | Kiowa | English |
| Minimum | 2.9% | 2.0% |
| Maximum | 47.7% | 100.0% |
| Range | 44.8% | 98.0% |
| Mean | 11.9% | 17.8% |
| Median | 10.0% | 7.4% |
| Interquartile 25% (IQ1) | 6.3% | 6.2% |
| Interquartile 75% (IQ3) | 15.3% | 13.0% |
| Interquartile Range (IQR) | 9.0% | 6.8% |
| Standard Deviation (Sample) | 9.7% | 24.7% |
| Standard Deviation (Population) | 9.5% | 24.6% |
Similar Demographics by Unemployment Among Ages 25 to 29 years
Demographics Similar to Kiowa by Unemployment Among Ages 25 to 29 years
In terms of unemployment among ages 25 to 29 years, the demographic groups most similar to Kiowa are Ecuadorian (7.4%, a difference of 0.080%), Immigrants from Western Africa (7.4%, a difference of 0.090%), Nigerian (7.4%, a difference of 0.13%), Immigrants from Fiji (7.4%, a difference of 0.15%), and American (7.4%, a difference of 0.22%).
| Demographics | Rating | Rank | Unemployment Among Ages 25 to 29 years |
| Mexican American Indians | 0.3 /100 | #256 | Tragic 7.3% |
| Assyrians/Chaldeans/Syriacs | 0.2 /100 | #257 | Tragic 7.3% |
| Ottawa | 0.1 /100 | #258 | Tragic 7.3% |
| Cree | 0.1 /100 | #259 | Tragic 7.3% |
| Americans | 0.1 /100 | #260 | Tragic 7.4% |
| Nigerians | 0.1 /100 | #261 | Tragic 7.4% |
| Ecuadorians | 0.1 /100 | #262 | Tragic 7.4% |
| Kiowa | 0.1 /100 | #263 | Tragic 7.4% |
| Immigrants | Western Africa | 0.1 /100 | #264 | Tragic 7.4% |
| Immigrants | Fiji | 0.1 /100 | #265 | Tragic 7.4% |
| Paiute | 0.1 /100 | #266 | Tragic 7.4% |
| Pennsylvania Germans | 0.1 /100 | #267 | Tragic 7.4% |
| Immigrants | Ecuador | 0.1 /100 | #268 | Tragic 7.4% |
| Immigrants | Latin America | 0.1 /100 | #269 | Tragic 7.4% |
| Bahamians | 0.0 /100 | #270 | Tragic 7.5% |
Demographics Similar to English by Unemployment Among Ages 25 to 29 years
In terms of unemployment among ages 25 to 29 years, the demographic groups most similar to English are Greek (6.6%, a difference of 0.030%), Immigrants from Northern Europe (6.6%, a difference of 0.040%), Immigrants from Middle Africa (6.6%, a difference of 0.090%), Immigrants from Czechoslovakia (6.6%, a difference of 0.14%), and Paraguayan (6.6%, a difference of 0.16%).
| Demographics | Rating | Rank | Unemployment Among Ages 25 to 29 years |
| Immigrants | Russia | 61.5 /100 | #158 | Good 6.6% |
| Welsh | 61.3 /100 | #159 | Good 6.6% |
| Scottish | 60.7 /100 | #160 | Good 6.6% |
| Paraguayans | 60.4 /100 | #161 | Good 6.6% |
| Immigrants | Czechoslovakia | 60.2 /100 | #162 | Good 6.6% |
| Immigrants | Middle Africa | 59.4 /100 | #163 | Average 6.6% |
| Greeks | 58.5 /100 | #164 | Average 6.6% |
| English | 58.0 /100 | #165 | Average 6.6% |
| Immigrants | Northern Europe | 57.3 /100 | #166 | Average 6.6% |
| Immigrants | Canada | 55.0 /100 | #167 | Average 6.6% |
| Estonians | 54.8 /100 | #168 | Average 6.6% |
| South Americans | 54.5 /100 | #169 | Average 6.6% |
| Albanians | 53.5 /100 | #170 | Average 6.6% |
| Immigrants | Cambodia | 52.6 /100 | #171 | Average 6.6% |
| Bangladeshis | 51.6 /100 | #172 | Average 6.6% |