Immigrants from Bulgaria vs Russian Unemployment Among Ages 65 to 74 years
COMPARE
Immigrants from Bulgaria
Russian
Unemployment Among Ages 65 to 74 years
Unemployment Among Ages 65 to 74 years Comparison
Immigrants from Bulgaria
Russians
5.1%
UNEMPLOYMENT AMONG AGES 65 TO 74 YEARS
99.4/ 100
METRIC RATING
59th/ 347
METRIC RANK
5.4%
UNEMPLOYMENT AMONG AGES 65 TO 74 YEARS
34.4/ 100
METRIC RATING
185th/ 347
METRIC RANK
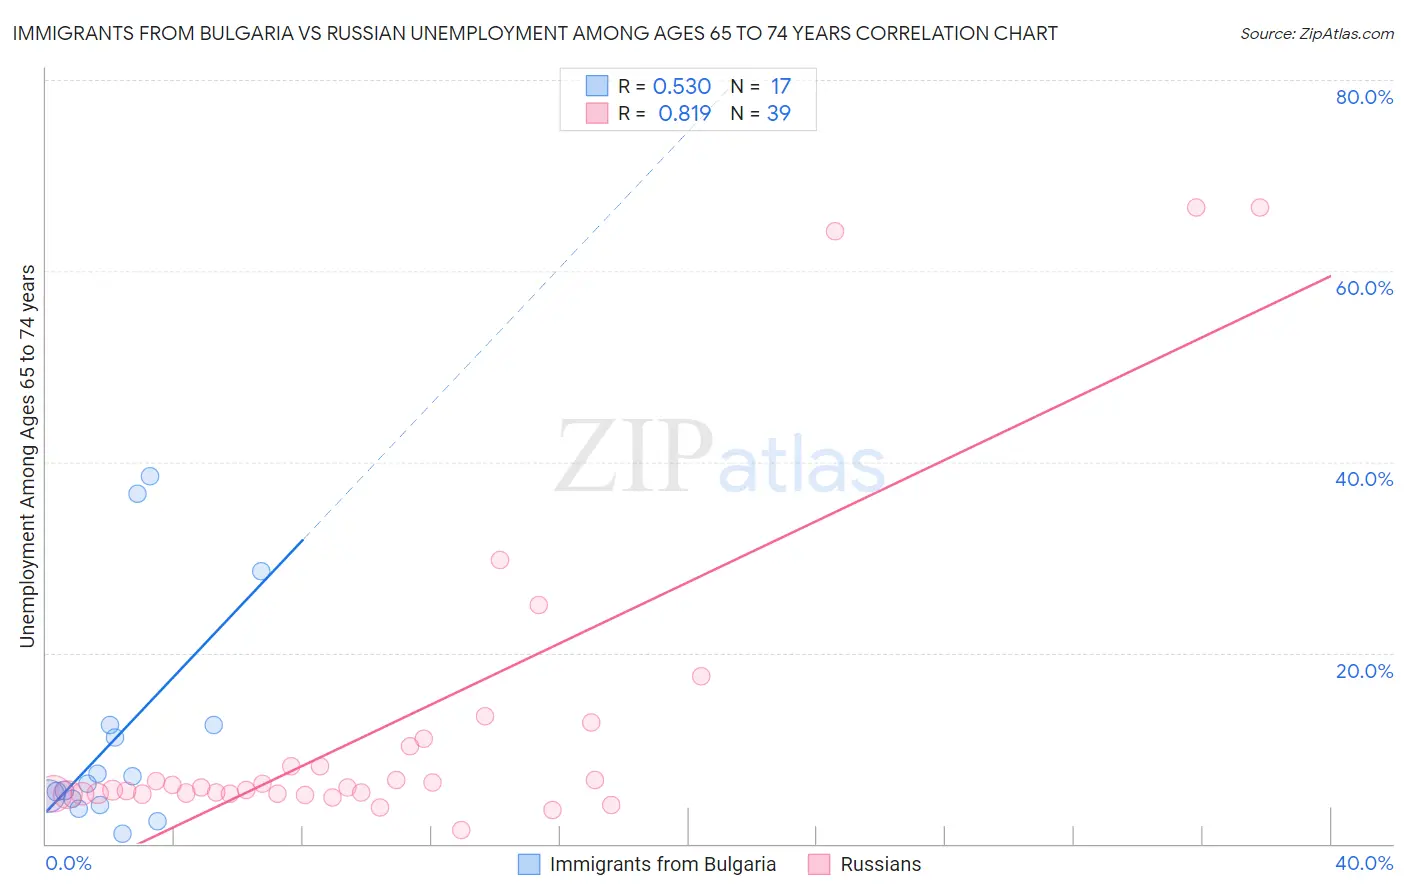
Immigrants from Bulgaria vs Russian Unemployment Among Ages 65 to 74 years Correlation Chart
The statistical analysis conducted on geographies consisting of 163,435,792 people shows a substantial positive correlation between the proportion of Immigrants from Bulgaria and unemployment rate among population between the ages 65 and 74 in the United States with a correlation coefficient (R) of 0.530 and weighted average of 5.1%. Similarly, the statistical analysis conducted on geographies consisting of 421,290,337 people shows a very strong positive correlation between the proportion of Russians and unemployment rate among population between the ages 65 and 74 in the United States with a correlation coefficient (R) of 0.819 and weighted average of 5.4%, a difference of 5.1%.
Unemployment Among Ages 65 to 74 years Correlation Summary
| Measurement | Immigrants from Bulgaria | Russian |
| Minimum | 1.0% | 1.5% |
| Maximum | 38.5% | 66.7% |
| Range | 37.5% | 65.2% |
| Mean | 11.3% | 12.2% |
| Median | 6.2% | 5.8% |
| Interquartile 25% (IQ1) | 4.4% | 5.3% |
| Interquartile 75% (IQ3) | 12.5% | 10.3% |
| Interquartile Range (IQR) | 8.1% | 5.0% |
| Standard Deviation (Sample) | 11.7% | 16.6% |
| Standard Deviation (Population) | 11.4% | 16.4% |
Similar Demographics by Unemployment Among Ages 65 to 74 years
Demographics Similar to Immigrants from Bulgaria by Unemployment Among Ages 65 to 74 years
In terms of unemployment among ages 65 to 74 years, the demographic groups most similar to Immigrants from Bulgaria are German (5.1%, a difference of 0.050%), Immigrants from Jordan (5.1%, a difference of 0.050%), Swedish (5.1%, a difference of 0.10%), Croatian (5.1%, a difference of 0.10%), and Immigrants from Taiwan (5.1%, a difference of 0.12%).
| Demographics | Rating | Rank | Unemployment Among Ages 65 to 74 years |
| Europeans | 99.6 /100 | #52 | Exceptional 5.1% |
| Immigrants | Ethiopia | 99.6 /100 | #53 | Exceptional 5.1% |
| Immigrants | Nicaragua | 99.6 /100 | #54 | Exceptional 5.1% |
| Carpatho Rusyns | 99.6 /100 | #55 | Exceptional 5.1% |
| Swedes | 99.5 /100 | #56 | Exceptional 5.1% |
| Croatians | 99.5 /100 | #57 | Exceptional 5.1% |
| Germans | 99.5 /100 | #58 | Exceptional 5.1% |
| Immigrants | Bulgaria | 99.4 /100 | #59 | Exceptional 5.1% |
| Immigrants | Jordan | 99.4 /100 | #60 | Exceptional 5.1% |
| Immigrants | Taiwan | 99.4 /100 | #61 | Exceptional 5.1% |
| Nicaraguans | 99.4 /100 | #62 | Exceptional 5.1% |
| Kiowa | 99.3 /100 | #63 | Exceptional 5.1% |
| Immigrants | Moldova | 99.3 /100 | #64 | Exceptional 5.1% |
| Bolivians | 99.3 /100 | #65 | Exceptional 5.1% |
| Iroquois | 99.3 /100 | #66 | Exceptional 5.1% |
Demographics Similar to Russians by Unemployment Among Ages 65 to 74 years
In terms of unemployment among ages 65 to 74 years, the demographic groups most similar to Russians are Immigrants from Senegal (5.4%, a difference of 0.030%), Lithuanian (5.4%, a difference of 0.070%), Immigrants from Spain (5.4%, a difference of 0.11%), Spanish American (5.4%, a difference of 0.14%), and Nonimmigrants (5.4%, a difference of 0.14%).
| Demographics | Rating | Rank | Unemployment Among Ages 65 to 74 years |
| French | 43.1 /100 | #178 | Average 5.4% |
| Guamanians/Chamorros | 42.1 /100 | #179 | Average 5.4% |
| Immigrants | Ireland | 42.0 /100 | #180 | Average 5.4% |
| Soviet Union | 40.0 /100 | #181 | Fair 5.4% |
| Spanish Americans | 38.2 /100 | #182 | Fair 5.4% |
| Immigrants | Spain | 37.3 /100 | #183 | Fair 5.4% |
| Immigrants | Senegal | 35.2 /100 | #184 | Fair 5.4% |
| Russians | 34.4 /100 | #185 | Fair 5.4% |
| Lithuanians | 32.4 /100 | #186 | Fair 5.4% |
| Immigrants | Nonimmigrants | 30.6 /100 | #187 | Fair 5.4% |
| Immigrants | Europe | 28.8 /100 | #188 | Fair 5.4% |
| Immigrants | Africa | 28.3 /100 | #189 | Fair 5.4% |
| Basques | 26.6 /100 | #190 | Fair 5.4% |
| Immigrants | Egypt | 26.5 /100 | #191 | Fair 5.4% |
| Maltese | 26.4 /100 | #192 | Fair 5.4% |