Belgian vs Russian Unemployment Among Ages 65 to 74 years
COMPARE
Belgian
Russian
Unemployment Among Ages 65 to 74 years
Unemployment Among Ages 65 to 74 years Comparison
Belgians
Russians
5.0%
UNEMPLOYMENT AMONG AGES 65 TO 74 YEARS
100.0/ 100
METRIC RATING
33rd/ 347
METRIC RANK
5.4%
UNEMPLOYMENT AMONG AGES 65 TO 74 YEARS
34.4/ 100
METRIC RATING
185th/ 347
METRIC RANK
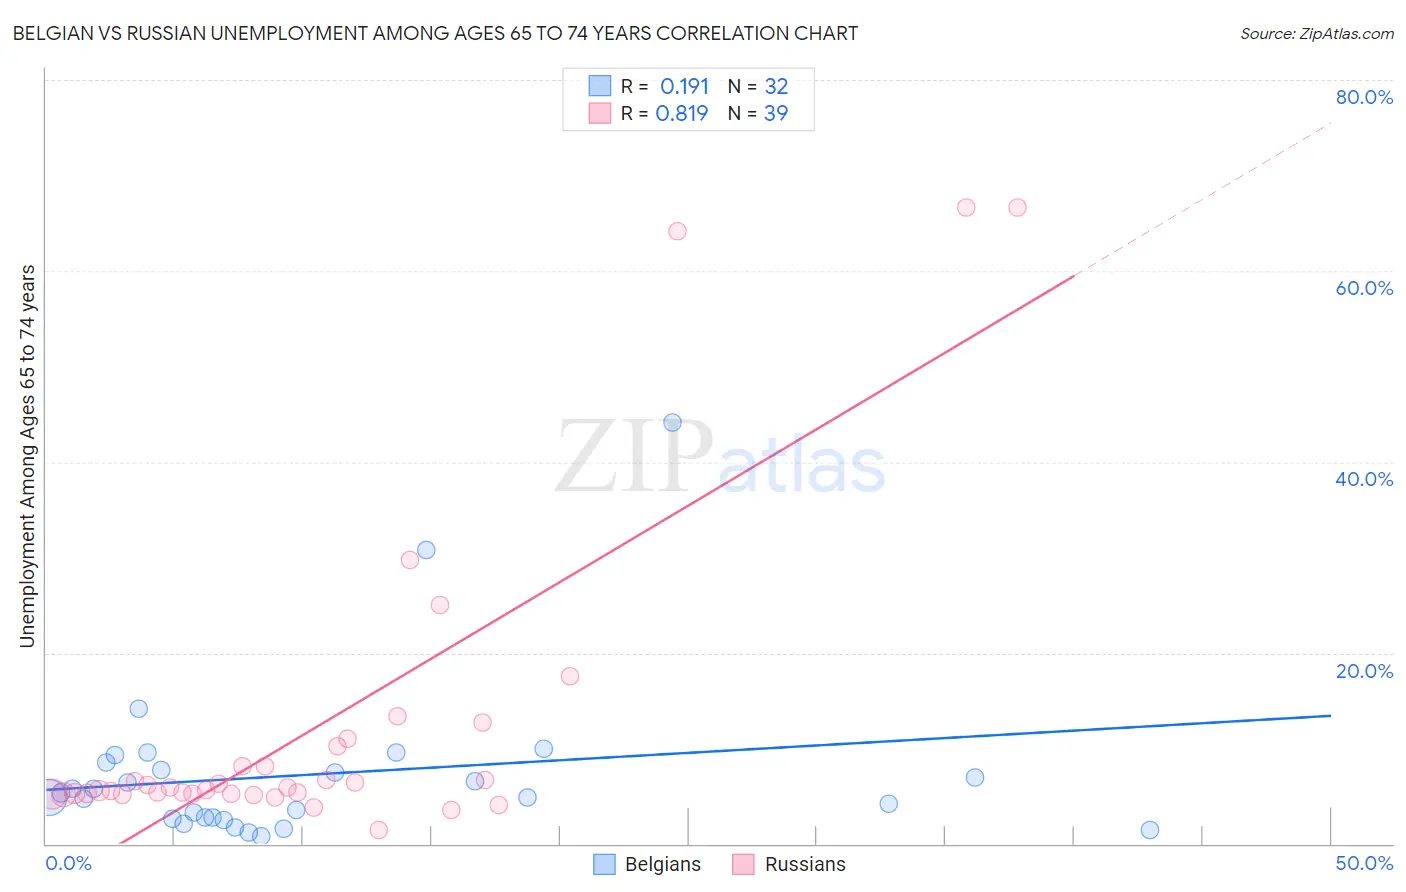
Belgian vs Russian Unemployment Among Ages 65 to 74 years Correlation Chart
The statistical analysis conducted on geographies consisting of 310,290,387 people shows a poor positive correlation between the proportion of Belgians and unemployment rate among population between the ages 65 and 74 in the United States with a correlation coefficient (R) of 0.191 and weighted average of 5.0%. Similarly, the statistical analysis conducted on geographies consisting of 421,290,337 people shows a very strong positive correlation between the proportion of Russians and unemployment rate among population between the ages 65 and 74 in the United States with a correlation coefficient (R) of 0.819 and weighted average of 5.4%, a difference of 7.5%.
Unemployment Among Ages 65 to 74 years Correlation Summary
| Measurement | Belgian | Russian |
| Minimum | 0.80% | 1.5% |
| Maximum | 44.1% | 66.7% |
| Range | 43.3% | 65.2% |
| Mean | 7.3% | 12.2% |
| Median | 5.1% | 5.8% |
| Interquartile 25% (IQ1) | 2.6% | 5.3% |
| Interquartile 75% (IQ3) | 8.1% | 10.3% |
| Interquartile Range (IQR) | 5.4% | 5.0% |
| Standard Deviation (Sample) | 8.7% | 16.6% |
| Standard Deviation (Population) | 8.5% | 16.4% |
Similar Demographics by Unemployment Among Ages 65 to 74 years
Demographics Similar to Belgians by Unemployment Among Ages 65 to 74 years
In terms of unemployment among ages 65 to 74 years, the demographic groups most similar to Belgians are Cambodian (5.0%, a difference of 0.0%), Palestinian (5.0%, a difference of 0.050%), Bhutanese (5.0%, a difference of 0.11%), Immigrants from Kuwait (5.0%, a difference of 0.30%), and Immigrants from Eastern Africa (5.0%, a difference of 0.32%).
| Demographics | Rating | Rank | Unemployment Among Ages 65 to 74 years |
| Czechs | 100.0 /100 | #26 | Exceptional 5.0% |
| Norwegians | 100.0 /100 | #27 | Exceptional 5.0% |
| Bulgarians | 100.0 /100 | #28 | Exceptional 5.0% |
| Ethiopians | 100.0 /100 | #29 | Exceptional 5.0% |
| Immigrants | Lebanon | 100.0 /100 | #30 | Exceptional 5.0% |
| Slovenes | 100.0 /100 | #31 | Exceptional 5.0% |
| Palestinians | 100.0 /100 | #32 | Exceptional 5.0% |
| Belgians | 100.0 /100 | #33 | Exceptional 5.0% |
| Cambodians | 100.0 /100 | #34 | Exceptional 5.0% |
| Bhutanese | 100.0 /100 | #35 | Exceptional 5.0% |
| Immigrants | Kuwait | 99.9 /100 | #36 | Exceptional 5.0% |
| Immigrants | Eastern Africa | 99.9 /100 | #37 | Exceptional 5.0% |
| Nepalese | 99.9 /100 | #38 | Exceptional 5.0% |
| Immigrants | Sweden | 99.9 /100 | #39 | Exceptional 5.0% |
| Immigrants | Iraq | 99.9 /100 | #40 | Exceptional 5.1% |
Demographics Similar to Russians by Unemployment Among Ages 65 to 74 years
In terms of unemployment among ages 65 to 74 years, the demographic groups most similar to Russians are Immigrants from Senegal (5.4%, a difference of 0.030%), Lithuanian (5.4%, a difference of 0.070%), Immigrants from Spain (5.4%, a difference of 0.11%), Spanish American (5.4%, a difference of 0.14%), and Nonimmigrants (5.4%, a difference of 0.14%).
| Demographics | Rating | Rank | Unemployment Among Ages 65 to 74 years |
| French | 43.1 /100 | #178 | Average 5.4% |
| Guamanians/Chamorros | 42.1 /100 | #179 | Average 5.4% |
| Immigrants | Ireland | 42.0 /100 | #180 | Average 5.4% |
| Soviet Union | 40.0 /100 | #181 | Fair 5.4% |
| Spanish Americans | 38.2 /100 | #182 | Fair 5.4% |
| Immigrants | Spain | 37.3 /100 | #183 | Fair 5.4% |
| Immigrants | Senegal | 35.2 /100 | #184 | Fair 5.4% |
| Russians | 34.4 /100 | #185 | Fair 5.4% |
| Lithuanians | 32.4 /100 | #186 | Fair 5.4% |
| Immigrants | Nonimmigrants | 30.6 /100 | #187 | Fair 5.4% |
| Immigrants | Europe | 28.8 /100 | #188 | Fair 5.4% |
| Immigrants | Africa | 28.3 /100 | #189 | Fair 5.4% |
| Basques | 26.6 /100 | #190 | Fair 5.4% |
| Immigrants | Egypt | 26.5 /100 | #191 | Fair 5.4% |
| Maltese | 26.4 /100 | #192 | Fair 5.4% |