Immigrants from Belize vs Tohono O'odham Unemployment Among Women with Children Under 6 years
COMPARE
Immigrants from Belize
Tohono O'odham
Unemployment Among Women with Children Under 6 years
Unemployment Among Women with Children Under 6 years Comparison
Immigrants from Belize
Tohono O'odham
8.6%
UNEMPLOYMENT AMONG WOMEN WITH CHILDREN UNDER 6 YEARS
0.0/ 100
METRIC RATING
280th/ 347
METRIC RANK
10.2%
UNEMPLOYMENT AMONG WOMEN WITH CHILDREN UNDER 6 YEARS
0.0/ 100
METRIC RATING
328th/ 347
METRIC RANK
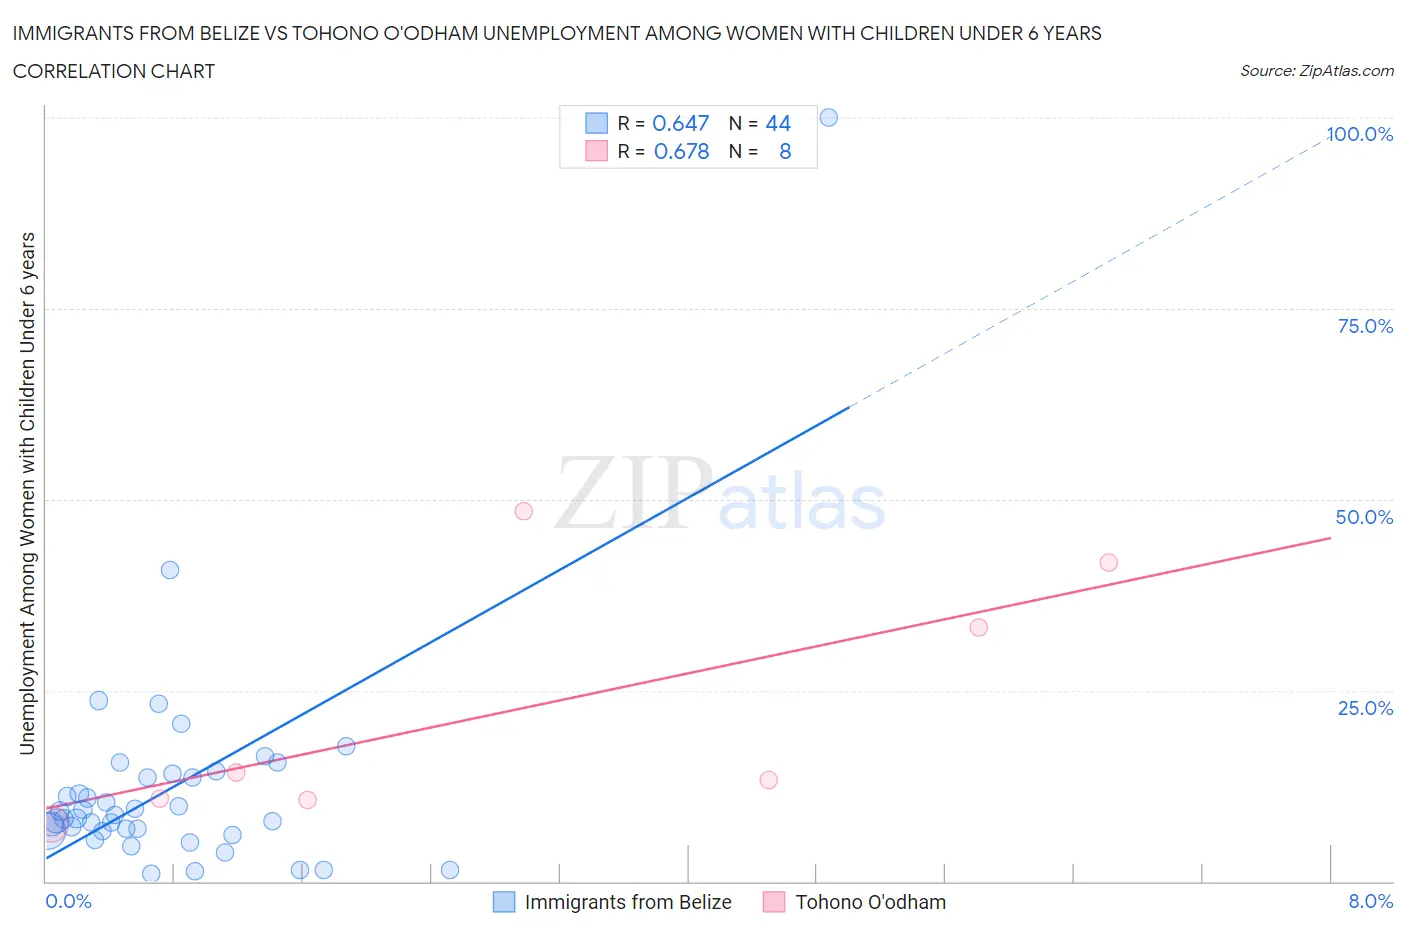
Immigrants from Belize vs Tohono O'odham Unemployment Among Women with Children Under 6 years Correlation Chart
The statistical analysis conducted on geographies consisting of 116,794,257 people shows a significant positive correlation between the proportion of Immigrants from Belize and unemployment rate among women with children under the age of 6 in the United States with a correlation coefficient (R) of 0.647 and weighted average of 8.6%. Similarly, the statistical analysis conducted on geographies consisting of 55,207,306 people shows a significant positive correlation between the proportion of Tohono O'odham and unemployment rate among women with children under the age of 6 in the United States with a correlation coefficient (R) of 0.678 and weighted average of 10.2%, a difference of 17.9%.
Unemployment Among Women with Children Under 6 years Correlation Summary
| Measurement | Immigrants from Belize | Tohono O'odham |
| Minimum | 1.0% | 7.5% |
| Maximum | 100.0% | 48.4% |
| Range | 99.0% | 40.9% |
| Mean | 12.3% | 22.5% |
| Median | 8.5% | 13.8% |
| Interquartile 25% (IQ1) | 6.6% | 10.8% |
| Interquartile 75% (IQ3) | 13.9% | 37.5% |
| Interquartile Range (IQR) | 7.3% | 26.7% |
| Standard Deviation (Sample) | 15.3% | 16.1% |
| Standard Deviation (Population) | 15.2% | 15.0% |
Similar Demographics by Unemployment Among Women with Children Under 6 years
Demographics Similar to Immigrants from Belize by Unemployment Among Women with Children Under 6 years
In terms of unemployment among women with children under 6 years, the demographic groups most similar to Immigrants from Belize are Immigrants from Guatemala (8.6%, a difference of 0.040%), Immigrants from Dominica (8.6%, a difference of 0.050%), Guatemalan (8.7%, a difference of 0.14%), Bermudan (8.7%, a difference of 0.23%), and Spanish American Indian (8.7%, a difference of 0.25%).
| Demographics | Rating | Rank | Unemployment Among Women with Children Under 6 years |
| Slovaks | 0.1 /100 | #273 | Tragic 8.5% |
| Immigrants | Cameroon | 0.1 /100 | #274 | Tragic 8.6% |
| Immigrants | Latin America | 0.1 /100 | #275 | Tragic 8.6% |
| Yaqui | 0.0 /100 | #276 | Tragic 8.6% |
| Haitians | 0.0 /100 | #277 | Tragic 8.6% |
| Immigrants | Dominica | 0.0 /100 | #278 | Tragic 8.6% |
| Immigrants | Guatemala | 0.0 /100 | #279 | Tragic 8.6% |
| Immigrants | Belize | 0.0 /100 | #280 | Tragic 8.6% |
| Guatemalans | 0.0 /100 | #281 | Tragic 8.7% |
| Bermudans | 0.0 /100 | #282 | Tragic 8.7% |
| Spanish American Indians | 0.0 /100 | #283 | Tragic 8.7% |
| Blackfeet | 0.0 /100 | #284 | Tragic 8.7% |
| U.S. Virgin Islanders | 0.0 /100 | #285 | Tragic 8.7% |
| Seminole | 0.0 /100 | #286 | Tragic 8.7% |
| Menominee | 0.0 /100 | #287 | Tragic 8.7% |
Demographics Similar to Tohono O'odham by Unemployment Among Women with Children Under 6 years
In terms of unemployment among women with children under 6 years, the demographic groups most similar to Tohono O'odham are Black/African American (10.3%, a difference of 0.74%), Ottawa (9.9%, a difference of 3.3%), Delaware (9.8%, a difference of 4.2%), Choctaw (9.8%, a difference of 4.2%), and Paiute (9.7%, a difference of 5.2%).
| Demographics | Rating | Rank | Unemployment Among Women with Children Under 6 years |
| Central American Indians | 0.0 /100 | #321 | Tragic 9.6% |
| Alaska Natives | 0.0 /100 | #322 | Tragic 9.6% |
| Immigrants | Bahamas | 0.0 /100 | #323 | Tragic 9.6% |
| Paiute | 0.0 /100 | #324 | Tragic 9.7% |
| Choctaw | 0.0 /100 | #325 | Tragic 9.8% |
| Delaware | 0.0 /100 | #326 | Tragic 9.8% |
| Ottawa | 0.0 /100 | #327 | Tragic 9.9% |
| Tohono O'odham | 0.0 /100 | #328 | Tragic 10.2% |
| Blacks/African Americans | 0.0 /100 | #329 | Tragic 10.3% |
| Pennsylvania Germans | 0.0 /100 | #330 | Tragic 10.8% |
| Colville | 0.0 /100 | #331 | Tragic 11.2% |
| Sioux | 0.0 /100 | #332 | Tragic 11.5% |
| Natives/Alaskans | 0.0 /100 | #333 | Tragic 11.5% |
| Apache | 0.0 /100 | #334 | Tragic 12.3% |
| Puerto Ricans | 0.0 /100 | #335 | Tragic 12.5% |