Immigrants from Barbados vs Nepalese Unemployment Among Ages 25 to 29 years
COMPARE
Immigrants from Barbados
Nepalese
Unemployment Among Ages 25 to 29 years
Unemployment Among Ages 25 to 29 years Comparison
Immigrants from Barbados
Nepalese
8.0%
UNEMPLOYMENT AMONG AGES 25 TO 29 YEARS
0.0/ 100
METRIC RATING
307th/ 347
METRIC RANK
7.5%
UNEMPLOYMENT AMONG AGES 25 TO 29 YEARS
0.0/ 100
METRIC RATING
279th/ 347
METRIC RANK
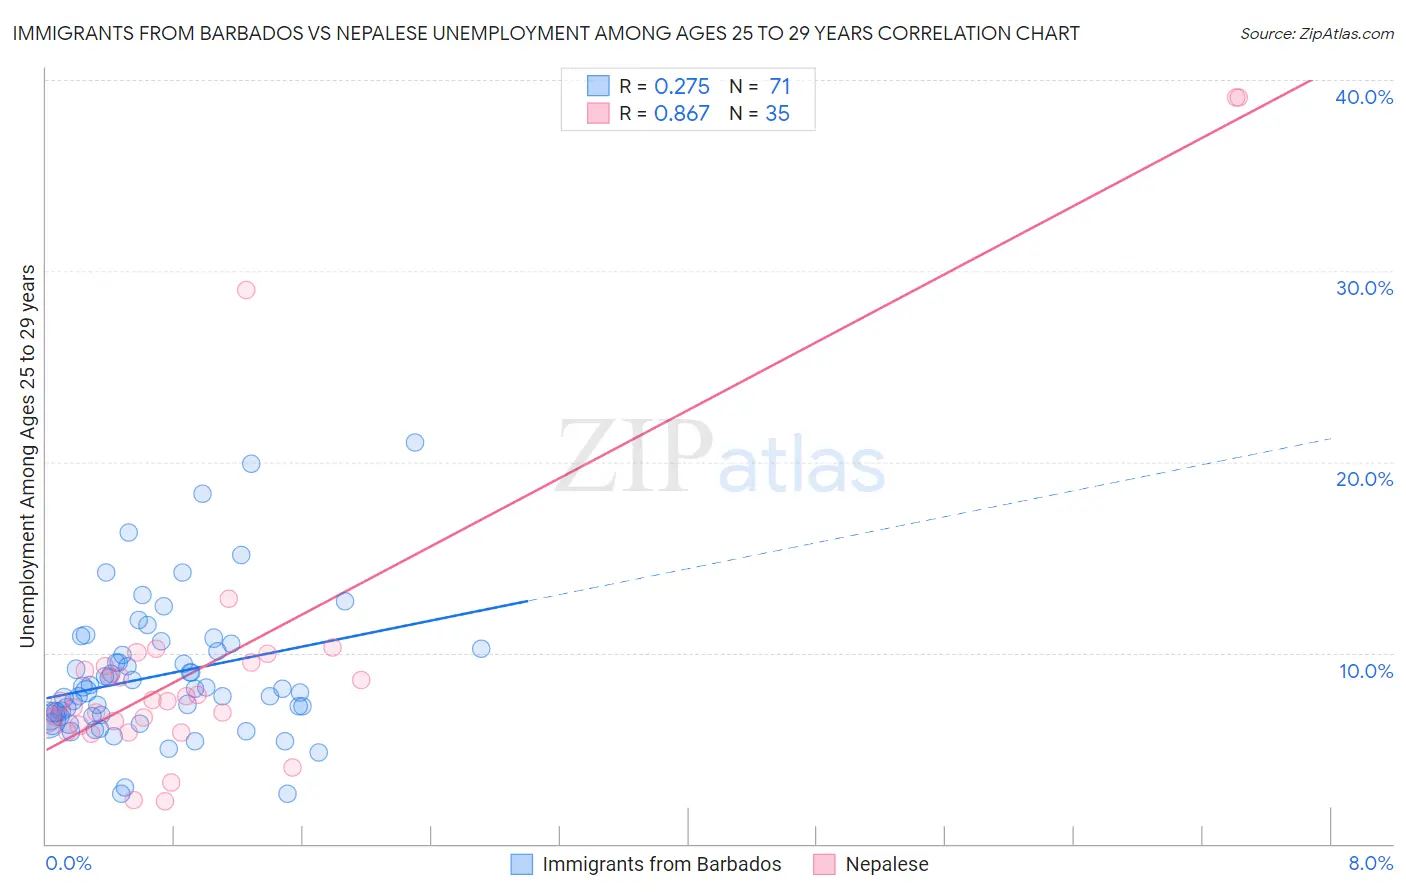
Immigrants from Barbados vs Nepalese Unemployment Among Ages 25 to 29 years Correlation Chart
The statistical analysis conducted on geographies consisting of 111,437,258 people shows a weak positive correlation between the proportion of Immigrants from Barbados and unemployment rate among population between the ages 25 and 29 in the United States with a correlation coefficient (R) of 0.275 and weighted average of 8.0%. Similarly, the statistical analysis conducted on geographies consisting of 24,366,935 people shows a very strong positive correlation between the proportion of Nepalese and unemployment rate among population between the ages 25 and 29 in the United States with a correlation coefficient (R) of 0.867 and weighted average of 7.5%, a difference of 6.9%.
Unemployment Among Ages 25 to 29 years Correlation Summary
| Measurement | Immigrants from Barbados | Nepalese |
| Minimum | 2.6% | 2.2% |
| Maximum | 21.0% | 39.1% |
| Range | 18.4% | 36.9% |
| Mean | 8.8% | 9.7% |
| Median | 8.1% | 7.4% |
| Interquartile 25% (IQ1) | 6.7% | 6.2% |
| Interquartile 75% (IQ3) | 10.2% | 9.5% |
| Interquartile Range (IQR) | 3.5% | 3.3% |
| Standard Deviation (Sample) | 3.6% | 8.5% |
| Standard Deviation (Population) | 3.5% | 8.4% |
Similar Demographics by Unemployment Among Ages 25 to 29 years
Demographics Similar to Immigrants from Barbados by Unemployment Among Ages 25 to 29 years
In terms of unemployment among ages 25 to 29 years, the demographic groups most similar to Immigrants from Barbados are Haitian (8.0%, a difference of 0.16%), Tsimshian (8.0%, a difference of 0.24%), Immigrants from Jamaica (8.1%, a difference of 0.42%), Immigrants from Haiti (8.1%, a difference of 0.43%), and U.S. Virgin Islander (8.1%, a difference of 0.44%).
| Demographics | Rating | Rank | Unemployment Among Ages 25 to 29 years |
| Central American Indians | 0.0 /100 | #300 | Tragic 7.9% |
| West Indians | 0.0 /100 | #301 | Tragic 7.9% |
| Jamaicans | 0.0 /100 | #302 | Tragic 7.9% |
| Immigrants | Yemen | 0.0 /100 | #303 | Tragic 8.0% |
| Cajuns | 0.0 /100 | #304 | Tragic 8.0% |
| Tsimshian | 0.0 /100 | #305 | Tragic 8.0% |
| Haitians | 0.0 /100 | #306 | Tragic 8.0% |
| Immigrants | Barbados | 0.0 /100 | #307 | Tragic 8.0% |
| Immigrants | Jamaica | 0.0 /100 | #308 | Tragic 8.1% |
| Immigrants | Haiti | 0.0 /100 | #309 | Tragic 8.1% |
| U.S. Virgin Islanders | 0.0 /100 | #310 | Tragic 8.1% |
| Immigrants | Azores | 0.0 /100 | #311 | Tragic 8.1% |
| Dutch West Indians | 0.0 /100 | #312 | Tragic 8.2% |
| Immigrants | St. Vincent and the Grenadines | 0.0 /100 | #313 | Tragic 8.4% |
| Immigrants | Dominica | 0.0 /100 | #314 | Tragic 8.4% |
Demographics Similar to Nepalese by Unemployment Among Ages 25 to 29 years
In terms of unemployment among ages 25 to 29 years, the demographic groups most similar to Nepalese are Mexican (7.5%, a difference of 0.13%), Immigrants from Caribbean (7.5%, a difference of 0.14%), Iroquois (7.5%, a difference of 0.17%), French American Indian (7.5%, a difference of 0.23%), and Immigrants from Bangladesh (7.5%, a difference of 0.23%).
| Demographics | Rating | Rank | Unemployment Among Ages 25 to 29 years |
| Immigrants | Bahamas | 0.0 /100 | #272 | Tragic 7.5% |
| Immigrants | Nigeria | 0.0 /100 | #273 | Tragic 7.5% |
| Immigrants | Central America | 0.0 /100 | #274 | Tragic 7.5% |
| Immigrants | Ghana | 0.0 /100 | #275 | Tragic 7.5% |
| French American Indians | 0.0 /100 | #276 | Tragic 7.5% |
| Iroquois | 0.0 /100 | #277 | Tragic 7.5% |
| Mexicans | 0.0 /100 | #278 | Tragic 7.5% |
| Nepalese | 0.0 /100 | #279 | Tragic 7.5% |
| Immigrants | Caribbean | 0.0 /100 | #280 | Tragic 7.5% |
| Immigrants | Bangladesh | 0.0 /100 | #281 | Tragic 7.5% |
| Immigrants | Senegal | 0.0 /100 | #282 | Tragic 7.6% |
| Creek | 0.0 /100 | #283 | Tragic 7.6% |
| Cherokee | 0.0 /100 | #284 | Tragic 7.6% |
| Senegalese | 0.0 /100 | #285 | Tragic 7.6% |
| Vietnamese | 0.0 /100 | #286 | Tragic 7.6% |