Immigrants from Barbados vs Immigrants from Poland Unemployment Among Ages 25 to 29 years
COMPARE
Immigrants from Barbados
Immigrants from Poland
Unemployment Among Ages 25 to 29 years
Unemployment Among Ages 25 to 29 years Comparison
Immigrants from Barbados
Immigrants from Poland
8.0%
UNEMPLOYMENT AMONG AGES 25 TO 29 YEARS
0.0/ 100
METRIC RATING
307th/ 347
METRIC RANK
6.3%
UNEMPLOYMENT AMONG AGES 25 TO 29 YEARS
95.7/ 100
METRIC RATING
82nd/ 347
METRIC RANK
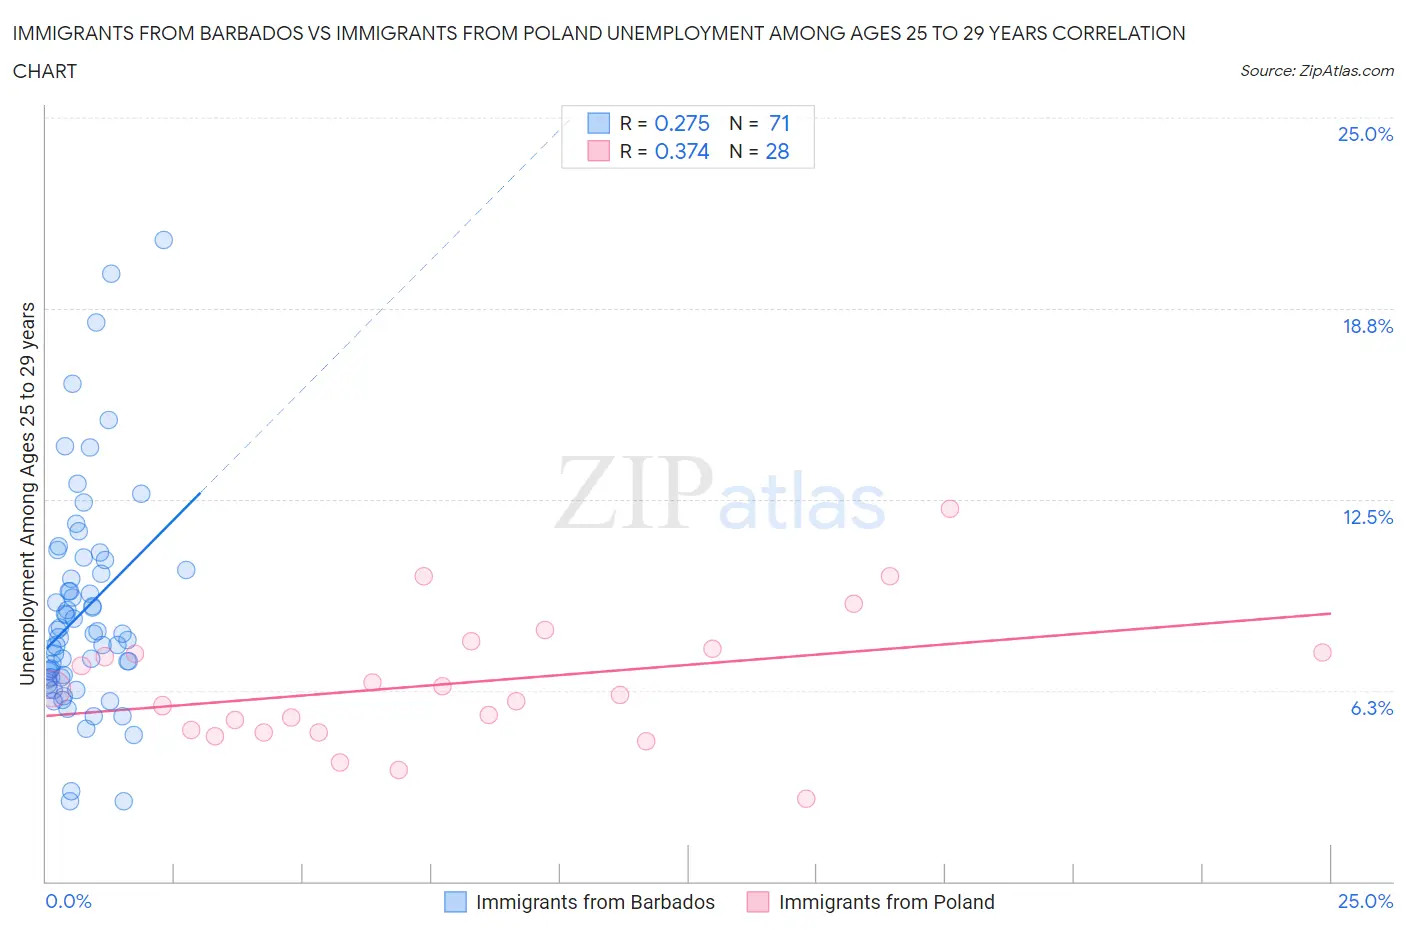
Immigrants from Barbados vs Immigrants from Poland Unemployment Among Ages 25 to 29 years Correlation Chart
The statistical analysis conducted on geographies consisting of 111,437,258 people shows a weak positive correlation between the proportion of Immigrants from Barbados and unemployment rate among population between the ages 25 and 29 in the United States with a correlation coefficient (R) of 0.275 and weighted average of 8.0%. Similarly, the statistical analysis conducted on geographies consisting of 291,999,632 people shows a mild positive correlation between the proportion of Immigrants from Poland and unemployment rate among population between the ages 25 and 29 in the United States with a correlation coefficient (R) of 0.374 and weighted average of 6.3%, a difference of 27.1%.
Unemployment Among Ages 25 to 29 years Correlation Summary
| Measurement | Immigrants from Barbados | Immigrants from Poland |
| Minimum | 2.6% | 2.7% |
| Maximum | 21.0% | 12.2% |
| Range | 18.4% | 9.5% |
| Mean | 8.8% | 6.5% |
| Median | 8.1% | 6.2% |
| Interquartile 25% (IQ1) | 6.7% | 4.9% |
| Interquartile 75% (IQ3) | 10.2% | 7.5% |
| Interquartile Range (IQR) | 3.5% | 2.6% |
| Standard Deviation (Sample) | 3.6% | 2.1% |
| Standard Deviation (Population) | 3.5% | 2.1% |
Similar Demographics by Unemployment Among Ages 25 to 29 years
Demographics Similar to Immigrants from Barbados by Unemployment Among Ages 25 to 29 years
In terms of unemployment among ages 25 to 29 years, the demographic groups most similar to Immigrants from Barbados are Haitian (8.0%, a difference of 0.16%), Tsimshian (8.0%, a difference of 0.24%), Immigrants from Jamaica (8.1%, a difference of 0.42%), Immigrants from Haiti (8.1%, a difference of 0.43%), and U.S. Virgin Islander (8.1%, a difference of 0.44%).
| Demographics | Rating | Rank | Unemployment Among Ages 25 to 29 years |
| Central American Indians | 0.0 /100 | #300 | Tragic 7.9% |
| West Indians | 0.0 /100 | #301 | Tragic 7.9% |
| Jamaicans | 0.0 /100 | #302 | Tragic 7.9% |
| Immigrants | Yemen | 0.0 /100 | #303 | Tragic 8.0% |
| Cajuns | 0.0 /100 | #304 | Tragic 8.0% |
| Tsimshian | 0.0 /100 | #305 | Tragic 8.0% |
| Haitians | 0.0 /100 | #306 | Tragic 8.0% |
| Immigrants | Barbados | 0.0 /100 | #307 | Tragic 8.0% |
| Immigrants | Jamaica | 0.0 /100 | #308 | Tragic 8.1% |
| Immigrants | Haiti | 0.0 /100 | #309 | Tragic 8.1% |
| U.S. Virgin Islanders | 0.0 /100 | #310 | Tragic 8.1% |
| Immigrants | Azores | 0.0 /100 | #311 | Tragic 8.1% |
| Dutch West Indians | 0.0 /100 | #312 | Tragic 8.2% |
| Immigrants | St. Vincent and the Grenadines | 0.0 /100 | #313 | Tragic 8.4% |
| Immigrants | Dominica | 0.0 /100 | #314 | Tragic 8.4% |
Demographics Similar to Immigrants from Poland by Unemployment Among Ages 25 to 29 years
In terms of unemployment among ages 25 to 29 years, the demographic groups most similar to Immigrants from Poland are Iranian (6.3%, a difference of 0.040%), Immigrants from Romania (6.3%, a difference of 0.080%), Slovene (6.3%, a difference of 0.13%), Immigrants from Switzerland (6.3%, a difference of 0.14%), and Immigrants from Spain (6.3%, a difference of 0.17%).
| Demographics | Rating | Rank | Unemployment Among Ages 25 to 29 years |
| Immigrants | Jordan | 96.8 /100 | #75 | Exceptional 6.3% |
| Immigrants | Korea | 96.7 /100 | #76 | Exceptional 6.3% |
| Icelanders | 96.6 /100 | #77 | Exceptional 6.3% |
| Asians | 96.4 /100 | #78 | Exceptional 6.3% |
| Immigrants | Switzerland | 96.0 /100 | #79 | Exceptional 6.3% |
| Immigrants | Romania | 95.9 /100 | #80 | Exceptional 6.3% |
| Iranians | 95.8 /100 | #81 | Exceptional 6.3% |
| Immigrants | Poland | 95.7 /100 | #82 | Exceptional 6.3% |
| Slovenes | 95.3 /100 | #83 | Exceptional 6.3% |
| Immigrants | Spain | 95.2 /100 | #84 | Exceptional 6.3% |
| Immigrants | Sweden | 95.1 /100 | #85 | Exceptional 6.3% |
| Immigrants | Asia | 94.9 /100 | #86 | Exceptional 6.3% |
| Marshallese | 94.7 /100 | #87 | Exceptional 6.4% |
| Immigrants | Indonesia | 94.5 /100 | #88 | Exceptional 6.4% |
| Immigrants | Oceania | 94.1 /100 | #89 | Exceptional 6.4% |