Mexican vs Nepalese Unemployment Among Ages 25 to 29 years

COMPARE

Mexican
Race
Ancestry
AfghanAfricanAlaska NativeAlaskan AthabascanAlbanianAleutAlsatianAmericanApacheArabArapahoArgentineanArmenianAssyrian/Chaldean/SyriacAustralianAustrianBahamianBangladeshiBarbadianBasqueBelgianBelizeanBermudanBhutaneseBlackfeetBolivianBrazilianBritishBritish West IndianBulgarianBurmeseCajunCambodianCanadianCape VerdeanCarpatho RusynCelticCentral AmericanCentral American IndianCherokeeCheyenneChickasawChileanChineseChippewaChoctawColombianColvilleComancheCosta RicanCreeCreekCroatianCrowCubanCypriotCzechCzechoslovakianDanishDelawareDominicanDutchDutch West IndianEastern EuropeanEcuadorianEgyptianEnglishEstonianEthiopianEuropeanFijianFilipinoFinnishFrenchFrench American IndianFrench CanadianGermanGerman RussianGhanaianGreekGuamanian/ChamorroGuatemalanGuyaneseHaitianHmongHonduranHopiHoumaHungarianIcelanderIndian (Asian)IndonesianInupiatIranianIraqiIrishIroquoisIsraeliItalianJamaicanJapaneseJordanianKenyanKiowaKoreanLaotianLatvianLebaneseLiberianLithuanianLumbeeLuxembourgerMacedonianMalaysianMalteseMarshalleseMenomineeMexicanMexican American IndianMongolianMoroccanNative HawaiianNavajoNew ZealanderNicaraguanNigerianNorthern EuropeanNorwegianOkinawanOsageOttawaPaiutePakistaniPalestinianPanamanianParaguayanPennsylvania GermanPeruvianPimaPolishPortuguesePotawatomiPuebloPuerto RicanPuget Sound SalishRomanianRussianSalvadoranSamoanScandinavianScotch-IrishScottishSeminoleSenegaleseSerbianShoshoneSierra LeoneanSiouxSlavicSlovakSloveneSomaliSouth AfricanSouth AmericanSouth American IndianSoviet UnionSpaniardSpanishSpanish AmericanSpanish American IndianSri LankanSubsaharan AfricanSudaneseSwedishSwissSyrianTaiwaneseThaiTlingit-HaidaTohono O'OdhamTonganTrinidadian and TobagonianTsimshianTurkishU.S. Virgin IslanderUgandanUkrainianUruguayanUteVenezuelanVietnameseWelshWest IndianYakamaYaquiYugoslavianYumanYup'ikZimbabwean
Immigration
NonimmigrantsImmigrantsAfghanistanAfricaAlbaniaArgentinaArmeniaAsiaAustraliaAustriaBahamasBangladeshBarbadosBelarusBelgiumBelizeBoliviaBosnia and HerzegovinaBrazilBulgariaBurma/MyanmarCabo VerdeCambodiaCameroonCanadaCaribbeanCentral AmericaChileChinaColombiaCongoCosta RicaCroatiaCubaCzechoslovakiaDenmarkDominicaDominican RepublicEastern AfricaEastern AsiaEastern EuropeEcuadorEgyptEl SalvadorEnglandEritreaEthiopiaEuropeFijiFranceGermanyGhanaGreeceGrenadaGuatemalaGuyanaHaitiHondurasHong KongHungaryIndiaIndonesiaIranIraqIrelandIsraelItalyJamaicaJapanJordanKazakhstanKenyaKoreaKuwaitLaosLatin AmericaLatviaLebanonLiberiaLithuaniaMalaysiaMexicoMicronesiaMiddle AfricaMoldovaMoroccoNepalNetherlandsNicaraguaNigeriaNorth AmericaNorth MacedoniaNorthern AfricaNorthern EuropeNorwayOceaniaPakistanPanamaPeruPhilippinesPolandPortugalRomaniaRussiaSaudi ArabiaScotlandSenegalSerbiaSierra LeoneSingaporeSomaliaSouth AfricaSouth AmericaSouth Central AsiaSouth Eastern AsiaSouthern EuropeSpainSri LankaSt. Vincent and the GrenadinesSudanSwedenSwitzerlandSyriaTaiwanThailandTrinidad and TobagoTurkeyUgandaUkraineUruguayUzbekistanVenezuelaVietnamWest IndiesWestern AfricaWestern AsiaWestern EuropeYemenZaireZimbabweAzores
Nepalese
Race
Ancestry
AfghanAfricanAlaska NativeAlaskan AthabascanAlbanianAleutAlsatianAmericanApacheArabArapahoArgentineanArmenianAssyrian/Chaldean/SyriacAustralianAustrianBahamianBangladeshiBarbadianBasqueBelgianBelizeanBermudanBhutaneseBlackfeetBolivianBrazilianBritishBritish West IndianBulgarianBurmeseCajunCambodianCanadianCape VerdeanCarpatho RusynCelticCentral AmericanCentral American IndianCherokeeCheyenneChickasawChileanChineseChippewaChoctawColombianColvilleComancheCosta RicanCreeCreekCroatianCrowCubanCypriotCzechCzechoslovakianDanishDelawareDominicanDutchDutch West IndianEastern EuropeanEcuadorianEgyptianEnglishEstonianEthiopianEuropeanFijianFilipinoFinnishFrenchFrench American IndianFrench CanadianGermanGerman RussianGhanaianGreekGuamanian/ChamorroGuatemalanGuyaneseHaitianHmongHonduranHopiHoumaHungarianIcelanderIndian (Asian)IndonesianInupiatIranianIraqiIrishIroquoisIsraeliItalianJamaicanJapaneseJordanianKenyanKiowaKoreanLaotianLatvianLebaneseLiberianLithuanianLumbeeLuxembourgerMacedonianMalaysianMalteseMarshalleseMenomineeMexican American IndianMongolianMoroccanNative HawaiianNavajoNepaleseNew ZealanderNicaraguanNigerianNorthern EuropeanNorwegianOkinawanOsageOttawaPaiutePakistaniPalestinianPanamanianParaguayanPennsylvania GermanPeruvianPimaPolishPortuguesePotawatomiPuebloPuerto RicanPuget Sound SalishRomanianRussianSalvadoranSamoanScandinavianScotch-IrishScottishSeminoleSenegaleseSerbianShoshoneSierra LeoneanSiouxSlavicSlovakSloveneSomaliSouth AfricanSouth AmericanSouth American IndianSoviet UnionSpaniardSpanishSpanish AmericanSpanish American IndianSri LankanSubsaharan AfricanSudaneseSwedishSwissSyrianTaiwaneseThaiTlingit-HaidaTohono O'OdhamTonganTrinidadian and TobagonianTsimshianTurkishU.S. Virgin IslanderUgandanUkrainianUruguayanUteVenezuelanVietnameseWelshWest IndianYakamaYaquiYugoslavianYumanYup'ikZimbabwean
Immigration
NonimmigrantsImmigrantsAfghanistanAfricaAlbaniaArgentinaArmeniaAsiaAustraliaAustriaBahamasBangladeshBarbadosBelarusBelgiumBelizeBoliviaBosnia and HerzegovinaBrazilBulgariaBurma/MyanmarCabo VerdeCambodiaCameroonCanadaCaribbeanCentral AmericaChileChinaColombiaCongoCosta RicaCroatiaCubaCzechoslovakiaDenmarkDominicaDominican RepublicEastern AfricaEastern AsiaEastern EuropeEcuadorEgyptEl SalvadorEnglandEritreaEthiopiaEuropeFijiFranceGermanyGhanaGreeceGrenadaGuatemalaGuyanaHaitiHondurasHong KongHungaryIndiaIndonesiaIranIraqIrelandIsraelItalyJamaicaJapanJordanKazakhstanKenyaKoreaKuwaitLaosLatin AmericaLatviaLebanonLiberiaLithuaniaMalaysiaMexicoMicronesiaMiddle AfricaMoldovaMoroccoNepalNetherlandsNicaraguaNigeriaNorth AmericaNorth MacedoniaNorthern AfricaNorthern EuropeNorwayOceaniaPakistanPanamaPeruPhilippinesPolandPortugalRomaniaRussiaSaudi ArabiaScotlandSenegalSerbiaSierra LeoneSingaporeSomaliaSouth AfricaSouth AmericaSouth Central AsiaSouth Eastern AsiaSouthern EuropeSpainSri LankaSt. Vincent and the GrenadinesSudanSwedenSwitzerlandSyriaTaiwanThailandTrinidad and TobagoTurkeyUgandaUkraineUruguayUzbekistanVenezuelaVietnamWest IndiesWestern AfricaWestern AsiaWestern EuropeYemenZaireZimbabweAzores
Unemployment Among Ages 25 to 29 years
Income
Poverty
Unemployment
Labor Participation
Family Structure
Vehicle Availability
Education Level
Disability

Unemployment Among Ages 25 to 29 years Comparison

Mexicans

Nepalese

Tragic
Tragic
7.5%
UNEMPLOYMENT AMONG AGES 25 TO 29 YEARS
0.0/ 100
METRIC RATING
278th/ 347
METRIC RANK
7.5%
UNEMPLOYMENT AMONG AGES 25 TO 29 YEARS
0.0/ 100
METRIC RATING
279th/ 347
METRIC RANK

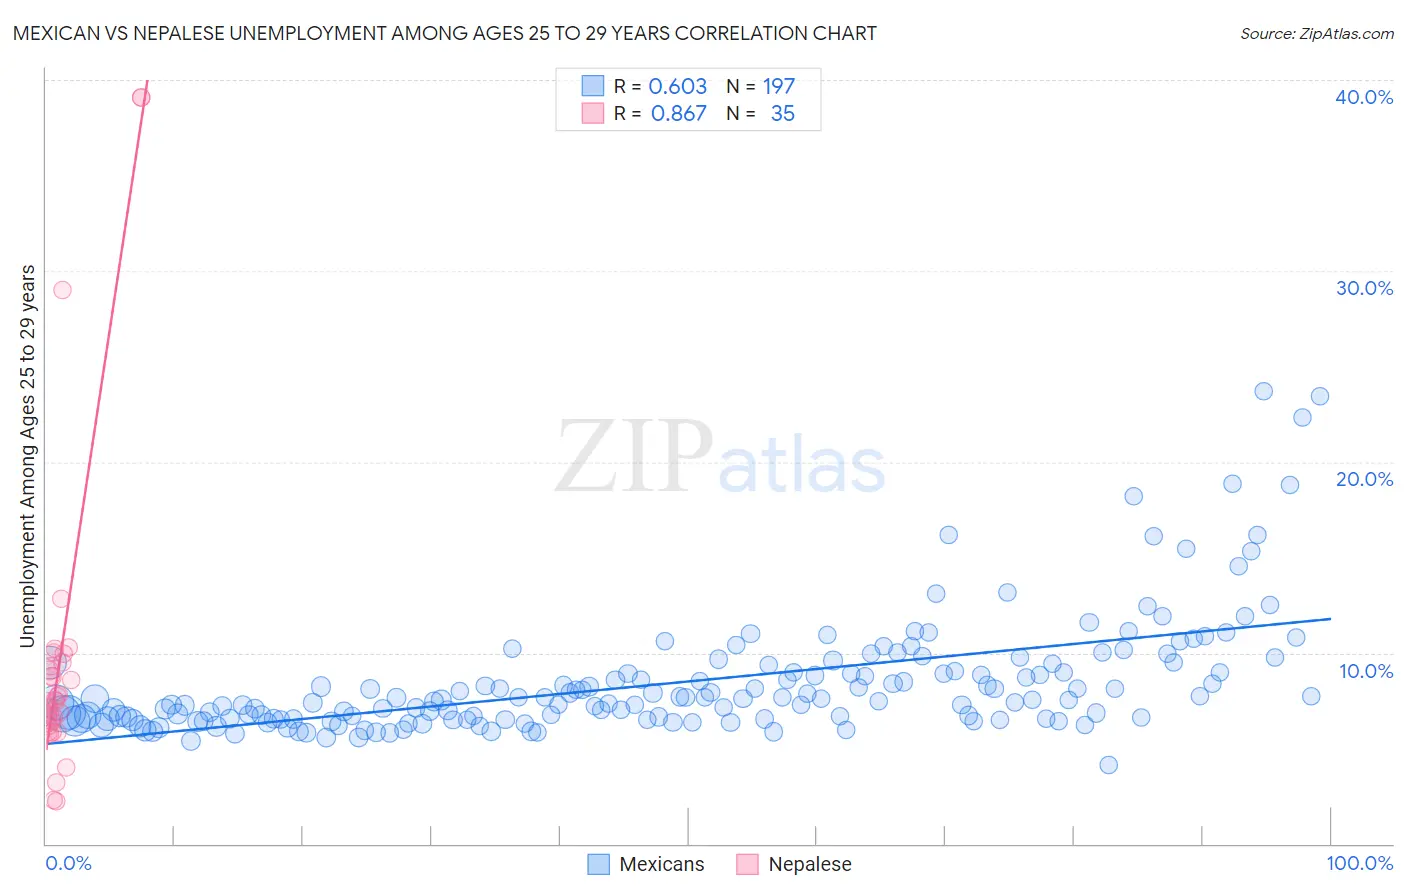
Mexican vs Nepalese Unemployment Among Ages 25 to 29 years Correlation Chart

The statistical analysis conducted on geographies consisting of 505,709,076 people shows a significant positive correlation between the proportion of Mexicans and unemployment rate among population between the ages 25 and 29 in the United States with a correlation coefficient (R) of 0.603 and weighted average of 7.5%. Similarly, the statistical analysis conducted on geographies consisting of 24,366,935 people shows a very strong positive correlation between the proportion of Nepalese and unemployment rate among population between the ages 25 and 29 in the United States with a correlation coefficient (R) of 0.867 and weighted average of 7.5%, a difference of 0.13%.
Mexican vs Nepalese Unemployment Among Ages 25 to 29 years

Unemployment Among Ages 25 to 29 years Correlation Summary

MeasurementMexicanNepalese
Minimum4.1%2.2%
Maximum23.7%39.1%
Range19.6%36.9%
Mean8.5%9.7%
Median7.6%7.4%
Interquartile 25% (IQ1)6.5%6.2%
Interquartile 75% (IQ3)9.0%9.5%
Interquartile Range (IQR)2.4%3.3%
Standard Deviation (Sample)3.1%8.5%
Standard Deviation (Population)3.1%8.4%

Demographics Similar to Mexicans and Nepalese by Unemployment Among Ages 25 to 29 years

In terms of unemployment among ages 25 to 29 years, the demographic groups most similar to Mexicans are Iroquois (7.5%, a difference of 0.040%), French American Indian (7.5%, a difference of 0.10%), Immigrants from Caribbean (7.5%, a difference of 0.27%), Immigrants from Bangladesh (7.5%, a difference of 0.36%), and Immigrants from Ghana (7.5%, a difference of 0.44%). Similarly, the demographic groups most similar to Nepalese are Immigrants from Caribbean (7.5%, a difference of 0.14%), Iroquois (7.5%, a difference of 0.17%), French American Indian (7.5%, a difference of 0.23%), Immigrants from Bangladesh (7.5%, a difference of 0.23%), and Immigrants from Senegal (7.6%, a difference of 0.41%).
DemographicsRating | RankUnemployment Among Ages 25 to 29 years
Immigrants | Ecuador
0.1
/100
|
#268
Tragic
7.4%
Immigrants | Latin America
0.1
/100
|
#269
Tragic
7.4%
Bahamians
0.0
/100
|
#270
Tragic
7.5%
Choctaw
0.0
/100
|
#271
Tragic
7.5%
Immigrants | Bahamas
0.0
/100
|
#272
Tragic
7.5%
Immigrants | Nigeria
0.0
/100
|
#273
Tragic
7.5%
Immigrants | Central America
0.0
/100
|
#274
Tragic
7.5%
Immigrants | Ghana
0.0
/100
|
#275
Tragic
7.5%
French American Indians
0.0
/100
|
#276
Tragic
7.5%
Iroquois
0.0
/100
|
#277
Tragic
7.5%
Mexicans
0.0
/100
|
#278
Tragic
7.5%
Nepalese
0.0
/100
|
#279
Tragic
7.5%
Immigrants | Caribbean
0.0
/100
|
#280
Tragic
7.5%
Immigrants | Bangladesh
0.0
/100
|
#281
Tragic
7.5%
Immigrants | Senegal
0.0
/100
|
#282
Tragic
7.6%
Creek
0.0
/100
|
#283
Tragic
7.6%
Cherokee
0.0
/100
|
#284
Tragic
7.6%
Senegalese
0.0
/100
|
#285
Tragic
7.6%
Vietnamese
0.0
/100
|
#286
Tragic
7.6%
Immigrants | Mexico
0.0
/100
|
#287
Tragic
7.6%
Africans
0.0
/100
|
#288
Tragic
7.6%