Immigrants from Barbados vs Black/African American Female Unemployment
COMPARE
Immigrants from Barbados
Black/African American
Female Unemployment
Female Unemployment Comparison
Immigrants from Barbados
Blacks/African Americans
6.2%
FEMALE UNEMPLOYMENT
0.0/ 100
METRIC RATING
301st/ 347
METRIC RANK
6.5%
FEMALE UNEMPLOYMENT
0.0/ 100
METRIC RATING
321st/ 347
METRIC RANK
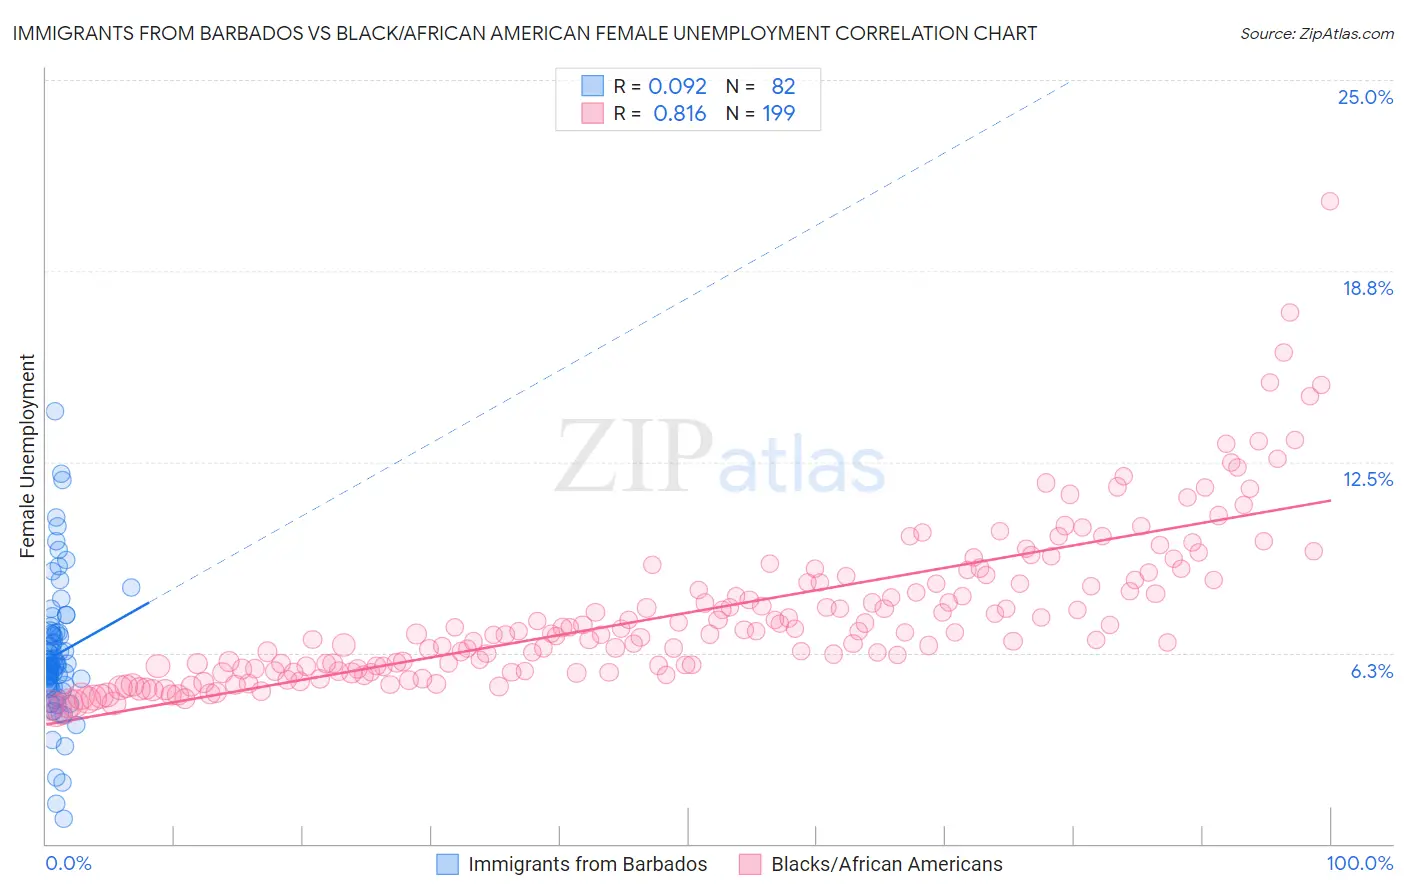
Immigrants from Barbados vs Black/African American Female Unemployment Correlation Chart
The statistical analysis conducted on geographies consisting of 112,711,300 people shows a slight positive correlation between the proportion of Immigrants from Barbados and unemploymnet rate among females in the United States with a correlation coefficient (R) of 0.092 and weighted average of 6.2%. Similarly, the statistical analysis conducted on geographies consisting of 554,894,161 people shows a very strong positive correlation between the proportion of Blacks/African Americans and unemploymnet rate among females in the United States with a correlation coefficient (R) of 0.816 and weighted average of 6.5%, a difference of 5.4%.
Female Unemployment Correlation Summary
| Measurement | Immigrants from Barbados | Black/African American |
| Minimum | 0.80% | 4.4% |
| Maximum | 14.2% | 21.0% |
| Range | 13.4% | 16.6% |
| Mean | 6.2% | 7.6% |
| Median | 5.8% | 6.9% |
| Interquartile 25% (IQ1) | 5.1% | 5.7% |
| Interquartile 75% (IQ3) | 6.9% | 8.6% |
| Interquartile Range (IQR) | 1.8% | 2.9% |
| Standard Deviation (Sample) | 2.2% | 2.6% |
| Standard Deviation (Population) | 2.2% | 2.6% |
Demographics Similar to Immigrants from Barbados and Blacks/African Americans by Female Unemployment
In terms of female unemployment, the demographic groups most similar to Immigrants from Barbados are U.S. Virgin Islander (6.2%, a difference of 0.15%), Barbadian (6.2%, a difference of 0.50%), Immigrants from Jamaica (6.2%, a difference of 0.87%), Spanish American Indian (6.2%, a difference of 0.92%), and Immigrants from Central America (6.2%, a difference of 1.1%). Similarly, the demographic groups most similar to Blacks/African Americans are Immigrants from Dominica (6.5%, a difference of 0.54%), Immigrants from Bangladesh (6.5%, a difference of 0.55%), British West Indian (6.4%, a difference of 0.74%), Immigrants from St. Vincent and the Grenadines (6.4%, a difference of 1.0%), and Houma (6.4%, a difference of 1.5%).
| Demographics | Rating | Rank | Female Unemployment |
| Immigrants | Barbados | 0.0 /100 | #301 | Tragic 6.2% |
| U.S. Virgin Islanders | 0.0 /100 | #302 | Tragic 6.2% |
| Barbadians | 0.0 /100 | #303 | Tragic 6.2% |
| Immigrants | Jamaica | 0.0 /100 | #304 | Tragic 6.2% |
| Spanish American Indians | 0.0 /100 | #305 | Tragic 6.2% |
| Immigrants | Central America | 0.0 /100 | #306 | Tragic 6.2% |
| Shoshone | 0.0 /100 | #307 | Tragic 6.2% |
| Hispanics or Latinos | 0.0 /100 | #308 | Tragic 6.2% |
| Ecuadorians | 0.0 /100 | #309 | Tragic 6.3% |
| Central American Indians | 0.0 /100 | #310 | Tragic 6.3% |
| Immigrants | Mexico | 0.0 /100 | #311 | Tragic 6.3% |
| Immigrants | Grenada | 0.0 /100 | #312 | Tragic 6.3% |
| Belizeans | 0.0 /100 | #313 | Tragic 6.3% |
| Immigrants | Ecuador | 0.0 /100 | #314 | Tragic 6.4% |
| Pueblo | 0.0 /100 | #315 | Tragic 6.4% |
| Houma | 0.0 /100 | #316 | Tragic 6.4% |
| Immigrants | St. Vincent and the Grenadines | 0.0 /100 | #317 | Tragic 6.4% |
| British West Indians | 0.0 /100 | #318 | Tragic 6.4% |
| Immigrants | Bangladesh | 0.0 /100 | #319 | Tragic 6.5% |
| Immigrants | Dominica | 0.0 /100 | #320 | Tragic 6.5% |
| Blacks/African Americans | 0.0 /100 | #321 | Tragic 6.5% |