Immigrants from Barbados vs Immigrants from Poland Child Poverty Under the Age of 16
COMPARE
Immigrants from Barbados
Immigrants from Poland
Child Poverty Under the Age of 16
Child Poverty Under the Age of 16 Comparison
Immigrants from Barbados
Immigrants from Poland
19.9%
CHILD POVERTY UNDER THE AGE OF 16
0.1/ 100
METRIC RATING
275th/ 347
METRIC RANK
14.3%
CHILD POVERTY UNDER THE AGE OF 16
97.9/ 100
METRIC RATING
71st/ 347
METRIC RANK
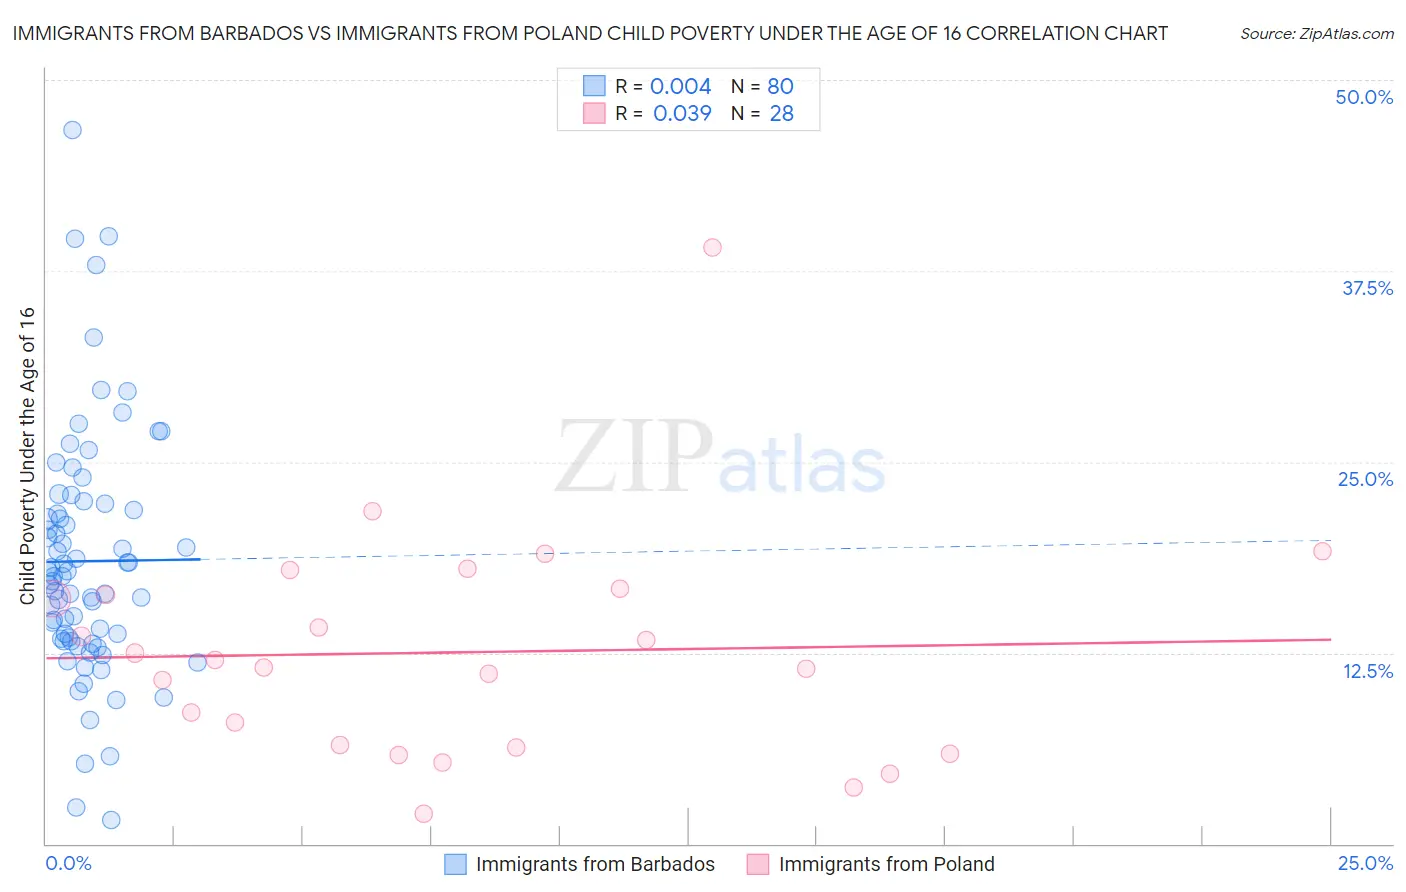
Immigrants from Barbados vs Immigrants from Poland Child Poverty Under the Age of 16 Correlation Chart
The statistical analysis conducted on geographies consisting of 112,587,035 people shows no correlation between the proportion of Immigrants from Barbados and poverty level among children under the age of 16 in the United States with a correlation coefficient (R) of 0.004 and weighted average of 19.9%. Similarly, the statistical analysis conducted on geographies consisting of 301,862,238 people shows no correlation between the proportion of Immigrants from Poland and poverty level among children under the age of 16 in the United States with a correlation coefficient (R) of 0.039 and weighted average of 14.3%, a difference of 38.5%.
Child Poverty Under the Age of 16 Correlation Summary
| Measurement | Immigrants from Barbados | Immigrants from Poland |
| Minimum | 1.6% | 2.0% |
| Maximum | 46.7% | 39.0% |
| Range | 45.2% | 37.1% |
| Mean | 18.5% | 12.5% |
| Median | 17.5% | 11.8% |
| Interquartile 25% (IQ1) | 13.3% | 6.4% |
| Interquartile 75% (IQ3) | 22.0% | 16.5% |
| Interquartile Range (IQR) | 8.7% | 10.1% |
| Standard Deviation (Sample) | 8.1% | 7.4% |
| Standard Deviation (Population) | 8.0% | 7.3% |
Similar Demographics by Child Poverty Under the Age of 16
Demographics Similar to Immigrants from Barbados by Child Poverty Under the Age of 16
In terms of child poverty under the age of 16, the demographic groups most similar to Immigrants from Barbados are Immigrants from Cabo Verde (19.9%, a difference of 0.0%), Belizean (19.9%, a difference of 0.0%), Iroquois (19.9%, a difference of 0.14%), Immigrants from Jamaica (19.8%, a difference of 0.16%), and Bangladeshi (19.9%, a difference of 0.24%).
| Demographics | Rating | Rank | Child Poverty Under the Age of 16 |
| Jamaicans | 0.1 /100 | #268 | Tragic 19.7% |
| Immigrants | El Salvador | 0.1 /100 | #269 | Tragic 19.7% |
| Spanish American Indians | 0.1 /100 | #270 | Tragic 19.7% |
| Immigrants | Liberia | 0.1 /100 | #271 | Tragic 19.7% |
| Immigrants | Bangladesh | 0.1 /100 | #272 | Tragic 19.8% |
| Immigrants | Jamaica | 0.1 /100 | #273 | Tragic 19.8% |
| Immigrants | Cabo Verde | 0.1 /100 | #274 | Tragic 19.9% |
| Immigrants | Barbados | 0.1 /100 | #275 | Tragic 19.9% |
| Belizeans | 0.1 /100 | #276 | Tragic 19.9% |
| Iroquois | 0.1 /100 | #277 | Tragic 19.9% |
| Bangladeshis | 0.0 /100 | #278 | Tragic 19.9% |
| Sub-Saharan Africans | 0.0 /100 | #279 | Tragic 19.9% |
| Comanche | 0.0 /100 | #280 | Tragic 19.9% |
| Central Americans | 0.0 /100 | #281 | Tragic 20.0% |
| Barbadians | 0.0 /100 | #282 | Tragic 20.0% |
Demographics Similar to Immigrants from Poland by Child Poverty Under the Age of 16
In terms of child poverty under the age of 16, the demographic groups most similar to Immigrants from Poland are Immigrants from Netherlands (14.3%, a difference of 0.0%), Immigrants from Bulgaria (14.3%, a difference of 0.11%), Laotian (14.3%, a difference of 0.18%), Cambodian (14.4%, a difference of 0.22%), and European (14.3%, a difference of 0.28%).
| Demographics | Rating | Rank | Child Poverty Under the Age of 16 |
| Immigrants | Romania | 98.3 /100 | #64 | Exceptional 14.2% |
| Immigrants | Philippines | 98.2 /100 | #65 | Exceptional 14.3% |
| Slovenes | 98.1 /100 | #66 | Exceptional 14.3% |
| Europeans | 98.1 /100 | #67 | Exceptional 14.3% |
| Laotians | 98.0 /100 | #68 | Exceptional 14.3% |
| Immigrants | Bulgaria | 98.0 /100 | #69 | Exceptional 14.3% |
| Immigrants | Netherlands | 97.9 /100 | #70 | Exceptional 14.3% |
| Immigrants | Poland | 97.9 /100 | #71 | Exceptional 14.3% |
| Cambodians | 97.8 /100 | #72 | Exceptional 14.4% |
| Immigrants | Turkey | 97.6 /100 | #73 | Exceptional 14.4% |
| Macedonians | 97.6 /100 | #74 | Exceptional 14.4% |
| Ukrainians | 97.5 /100 | #75 | Exceptional 14.4% |
| Immigrants | Eastern Europe | 97.5 /100 | #76 | Exceptional 14.4% |
| Australians | 97.5 /100 | #77 | Exceptional 14.4% |
| Immigrants | Russia | 97.3 /100 | #78 | Exceptional 14.5% |