Immigrants from the Azores vs Immigrants from Dominican Republic Unemployment Among Ages 20 to 24 years
COMPARE
Immigrants from the Azores
Immigrants from Dominican Republic
Unemployment Among Ages 20 to 24 years
Unemployment Among Ages 20 to 24 years Comparison
Immigrants from the Azores
Immigrants from Dominican Republic
10.2%
UNEMPLOYMENT AMONG AGES 20 TO 24 YEARS
81.4/ 100
METRIC RATING
141st/ 347
METRIC RANK
13.6%
UNEMPLOYMENT AMONG AGES 20 TO 24 YEARS
0.0/ 100
METRIC RATING
327th/ 347
METRIC RANK
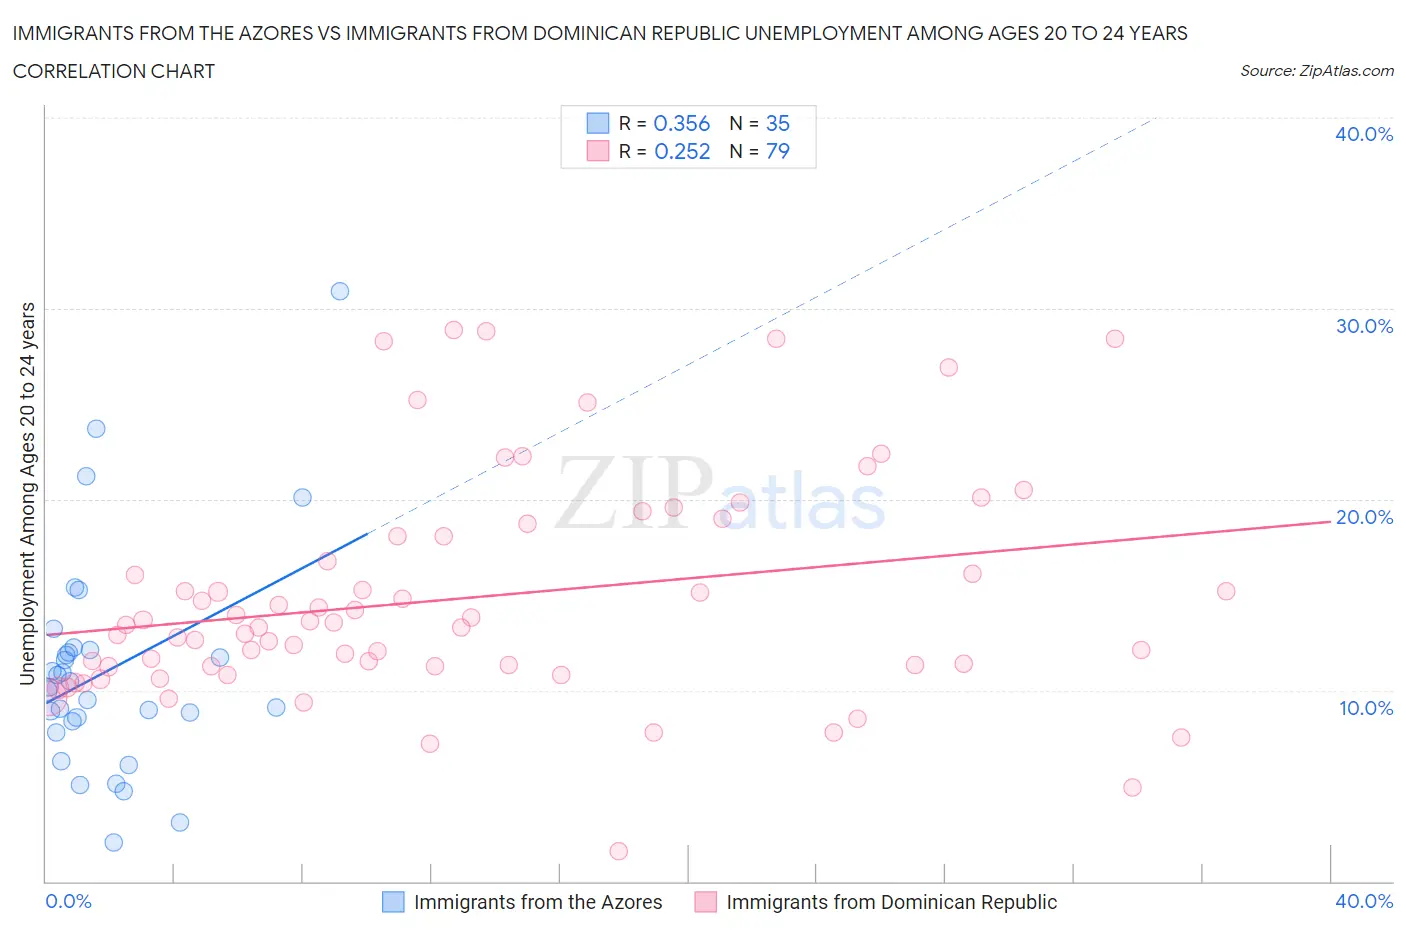
Immigrants from the Azores vs Immigrants from Dominican Republic Unemployment Among Ages 20 to 24 years Correlation Chart
The statistical analysis conducted on geographies consisting of 45,705,987 people shows a mild positive correlation between the proportion of Immigrants from the Azores and unemployment rate among population between the ages 20 and 24 in the United States with a correlation coefficient (R) of 0.356 and weighted average of 10.2%. Similarly, the statistical analysis conducted on geographies consisting of 268,842,062 people shows a weak positive correlation between the proportion of Immigrants from Dominican Republic and unemployment rate among population between the ages 20 and 24 in the United States with a correlation coefficient (R) of 0.252 and weighted average of 13.6%, a difference of 34.1%.
Unemployment Among Ages 20 to 24 years Correlation Summary
| Measurement | Immigrants from the Azores | Immigrants from Dominican Republic |
| Minimum | 2.0% | 1.6% |
| Maximum | 30.9% | 28.9% |
| Range | 28.9% | 27.3% |
| Mean | 11.0% | 14.8% |
| Median | 10.2% | 13.4% |
| Interquartile 25% (IQ1) | 8.4% | 11.2% |
| Interquartile 75% (IQ3) | 12.1% | 18.1% |
| Interquartile Range (IQR) | 3.7% | 6.8% |
| Standard Deviation (Sample) | 5.8% | 5.8% |
| Standard Deviation (Population) | 5.7% | 5.8% |
Similar Demographics by Unemployment Among Ages 20 to 24 years
Demographics Similar to Immigrants from the Azores by Unemployment Among Ages 20 to 24 years
In terms of unemployment among ages 20 to 24 years, the demographic groups most similar to Immigrants from the Azores are Immigrants from Austria (10.2%, a difference of 0.0%), Uruguayan (10.2%, a difference of 0.030%), Burmese (10.2%, a difference of 0.060%), Immigrants from Northern Africa (10.2%, a difference of 0.070%), and Immigrants from North America (10.2%, a difference of 0.070%).
| Demographics | Rating | Rank | Unemployment Among Ages 20 to 24 years |
| Romanians | 83.8 /100 | #134 | Excellent 10.2% |
| Comanche | 83.4 /100 | #135 | Excellent 10.2% |
| Immigrants | Northern Africa | 82.5 /100 | #136 | Excellent 10.2% |
| Immigrants | North America | 82.5 /100 | #137 | Excellent 10.2% |
| Burmese | 82.3 /100 | #138 | Excellent 10.2% |
| Uruguayans | 81.9 /100 | #139 | Excellent 10.2% |
| Immigrants | Austria | 81.4 /100 | #140 | Excellent 10.2% |
| Immigrants | Azores | 81.4 /100 | #141 | Excellent 10.2% |
| Slovaks | 80.2 /100 | #142 | Excellent 10.2% |
| Immigrants | Jordan | 79.0 /100 | #143 | Good 10.2% |
| Brazilians | 78.4 /100 | #144 | Good 10.2% |
| Argentineans | 78.0 /100 | #145 | Good 10.2% |
| Asians | 77.7 /100 | #146 | Good 10.2% |
| French Canadians | 77.5 /100 | #147 | Good 10.2% |
| Immigrants | Romania | 75.7 /100 | #148 | Good 10.2% |
Demographics Similar to Immigrants from Dominican Republic by Unemployment Among Ages 20 to 24 years
In terms of unemployment among ages 20 to 24 years, the demographic groups most similar to Immigrants from Dominican Republic are British West Indian (13.7%, a difference of 0.56%), Dominican (13.8%, a difference of 1.1%), Arapaho (13.8%, a difference of 1.2%), Immigrants from Barbados (13.5%, a difference of 1.3%), and Aleut (13.8%, a difference of 1.5%).
| Demographics | Rating | Rank | Unemployment Among Ages 20 to 24 years |
| Cheyenne | 0.0 /100 | #320 | Tragic 13.0% |
| Immigrants | Jamaica | 0.0 /100 | #321 | Tragic 13.0% |
| Natives/Alaskans | 0.0 /100 | #322 | Tragic 13.0% |
| Yakama | 0.0 /100 | #323 | Tragic 13.1% |
| Alaska Natives | 0.0 /100 | #324 | Tragic 13.2% |
| Pueblo | 0.0 /100 | #325 | Tragic 13.2% |
| Immigrants | Barbados | 0.0 /100 | #326 | Tragic 13.5% |
| Immigrants | Dominican Republic | 0.0 /100 | #327 | Tragic 13.6% |
| British West Indians | 0.0 /100 | #328 | Tragic 13.7% |
| Dominicans | 0.0 /100 | #329 | Tragic 13.8% |
| Arapaho | 0.0 /100 | #330 | Tragic 13.8% |
| Aleuts | 0.0 /100 | #331 | Tragic 13.8% |
| Immigrants | Grenada | 0.0 /100 | #332 | Tragic 13.8% |
| Immigrants | Guyana | 0.0 /100 | #333 | Tragic 13.9% |
| Guyanese | 0.0 /100 | #334 | Tragic 14.0% |