Immigrants from the Azores vs Immigrants from Dominican Republic In Labor Force | Age 35-44
COMPARE
Immigrants from the Azores
Immigrants from Dominican Republic
In Labor Force | Age 35-44
In Labor Force | Age 35-44 Comparison
Immigrants from the Azores
Immigrants from Dominican Republic
83.6%
IN LABOR FORCE | AGE 35-44
0.3/ 100
METRIC RATING
255th/ 347
METRIC RANK
82.9%
IN LABOR FORCE | AGE 35-44
0.0/ 100
METRIC RATING
284th/ 347
METRIC RANK
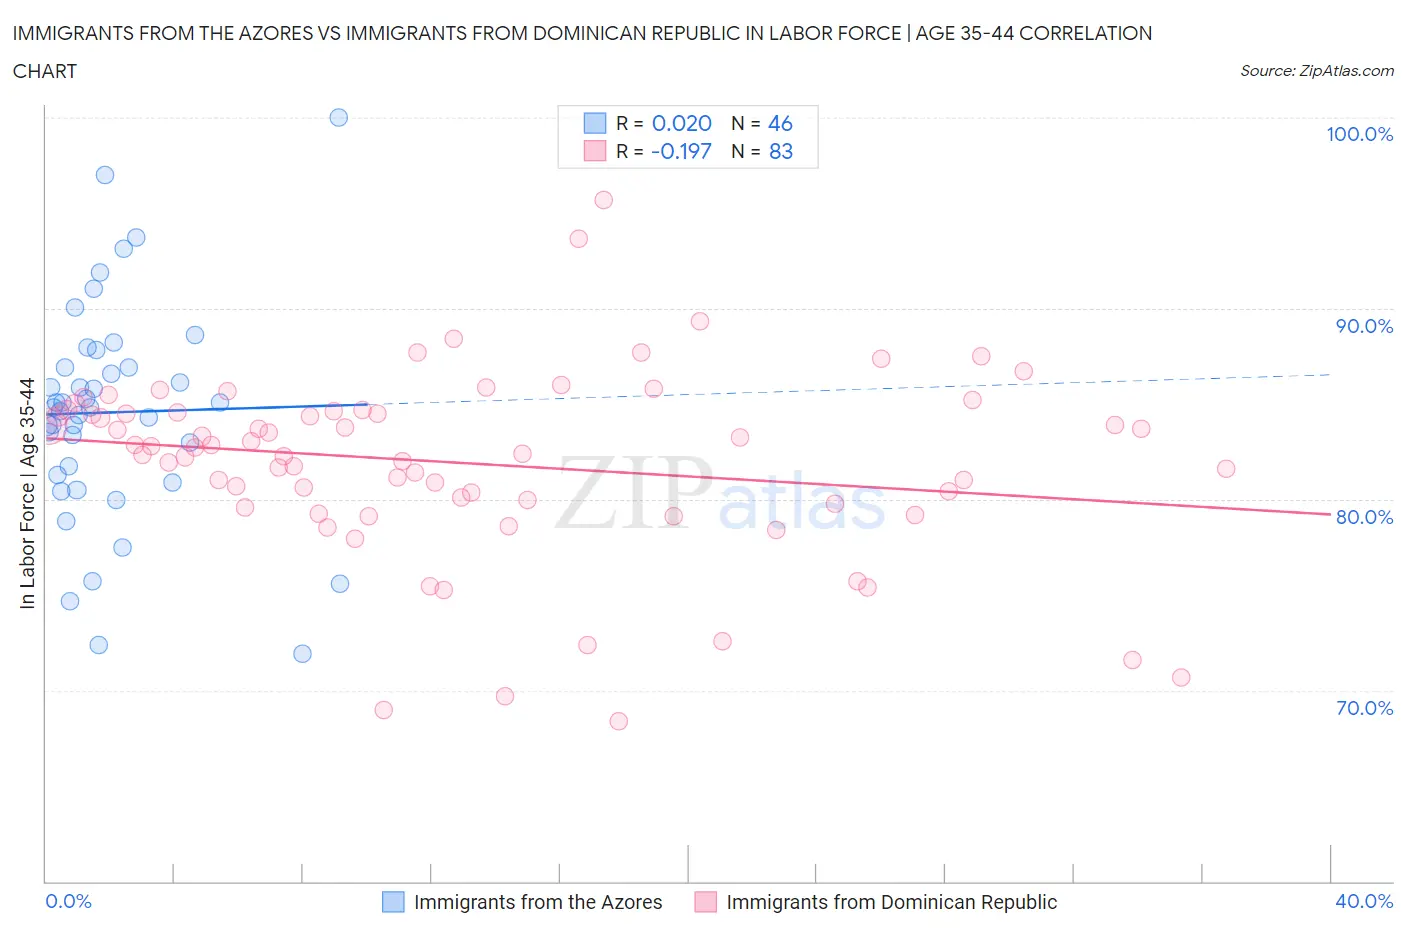
Immigrants from the Azores vs Immigrants from Dominican Republic In Labor Force | Age 35-44 Correlation Chart
The statistical analysis conducted on geographies consisting of 46,255,130 people shows no correlation between the proportion of Immigrants from the Azores and labor force participation rate among population between the ages 35 and 44 in the United States with a correlation coefficient (R) of 0.020 and weighted average of 83.6%. Similarly, the statistical analysis conducted on geographies consisting of 275,005,604 people shows a poor negative correlation between the proportion of Immigrants from Dominican Republic and labor force participation rate among population between the ages 35 and 44 in the United States with a correlation coefficient (R) of -0.197 and weighted average of 82.9%, a difference of 0.78%.
In Labor Force | Age 35-44 Correlation Summary
| Measurement | Immigrants from the Azores | Immigrants from Dominican Republic |
| Minimum | 71.9% | 68.4% |
| Maximum | 100.0% | 95.7% |
| Range | 28.1% | 27.3% |
| Mean | 84.6% | 81.9% |
| Median | 84.8% | 82.7% |
| Interquartile 25% (IQ1) | 81.3% | 79.8% |
| Interquartile 75% (IQ3) | 86.9% | 84.6% |
| Interquartile Range (IQR) | 5.6% | 4.9% |
| Standard Deviation (Sample) | 5.8% | 4.9% |
| Standard Deviation (Population) | 5.7% | 4.9% |
Similar Demographics by In Labor Force | Age 35-44
Demographics Similar to Immigrants from the Azores by In Labor Force | Age 35-44
In terms of in labor force | age 35-44, the demographic groups most similar to Immigrants from the Azores are Japanese (83.6%, a difference of 0.020%), Tongan (83.6%, a difference of 0.030%), Basque (83.6%, a difference of 0.030%), Salvadoran (83.6%, a difference of 0.040%), and Immigrants from Guyana (83.6%, a difference of 0.040%).
| Demographics | Rating | Rank | In Labor Force | Age 35-44 |
| Indonesians | 0.8 /100 | #248 | Tragic 83.7% |
| Immigrants | St. Vincent and the Grenadines | 0.7 /100 | #249 | Tragic 83.7% |
| Whites/Caucasians | 0.5 /100 | #250 | Tragic 83.6% |
| Salvadorans | 0.4 /100 | #251 | Tragic 83.6% |
| Immigrants | Guyana | 0.4 /100 | #252 | Tragic 83.6% |
| Lebanese | 0.4 /100 | #253 | Tragic 83.6% |
| Tongans | 0.4 /100 | #254 | Tragic 83.6% |
| Immigrants | Azores | 0.3 /100 | #255 | Tragic 83.6% |
| Japanese | 0.3 /100 | #256 | Tragic 83.6% |
| Basques | 0.3 /100 | #257 | Tragic 83.6% |
| Tsimshian | 0.2 /100 | #258 | Tragic 83.5% |
| Immigrants | El Salvador | 0.2 /100 | #259 | Tragic 83.5% |
| Vietnamese | 0.2 /100 | #260 | Tragic 83.5% |
| Immigrants | Dominica | 0.2 /100 | #261 | Tragic 83.5% |
| Immigrants | Congo | 0.2 /100 | #262 | Tragic 83.5% |
Demographics Similar to Immigrants from Dominican Republic by In Labor Force | Age 35-44
In terms of in labor force | age 35-44, the demographic groups most similar to Immigrants from Dominican Republic are Osage (82.9%, a difference of 0.010%), Immigrants from Guatemala (82.9%, a difference of 0.010%), Fijian (82.9%, a difference of 0.010%), Immigrants from Bangladesh (82.9%, a difference of 0.010%), and Immigrants from Belize (82.9%, a difference of 0.020%).
| Demographics | Rating | Rank | In Labor Force | Age 35-44 |
| Samoans | 0.0 /100 | #277 | Tragic 83.2% |
| Belizeans | 0.0 /100 | #278 | Tragic 83.1% |
| Immigrants | Micronesia | 0.0 /100 | #279 | Tragic 83.1% |
| Dominicans | 0.0 /100 | #280 | Tragic 83.1% |
| Guatemalans | 0.0 /100 | #281 | Tragic 83.0% |
| Osage | 0.0 /100 | #282 | Tragic 82.9% |
| Immigrants | Guatemala | 0.0 /100 | #283 | Tragic 82.9% |
| Immigrants | Dominican Republic | 0.0 /100 | #284 | Tragic 82.9% |
| Fijians | 0.0 /100 | #285 | Tragic 82.9% |
| Immigrants | Bangladesh | 0.0 /100 | #286 | Tragic 82.9% |
| Immigrants | Belize | 0.0 /100 | #287 | Tragic 82.9% |
| Puget Sound Salish | 0.0 /100 | #288 | Tragic 82.9% |
| Chippewa | 0.0 /100 | #289 | Tragic 82.9% |
| Africans | 0.0 /100 | #290 | Tragic 82.9% |
| Pennsylvania Germans | 0.0 /100 | #291 | Tragic 82.9% |