Immigrants from Austria vs Immigrants from Fiji Unemployment Among Ages 45 to 54 years
COMPARE
Immigrants from Austria
Immigrants from Fiji
Unemployment Among Ages 45 to 54 years
Unemployment Among Ages 45 to 54 years Comparison
Immigrants from Austria
Immigrants from Fiji
4.5%
UNEMPLOYMENT AMONG AGES 45 TO 54 YEARS
75.3/ 100
METRIC RATING
148th/ 347
METRIC RANK
4.9%
UNEMPLOYMENT AMONG AGES 45 TO 54 YEARS
0.1/ 100
METRIC RATING
263rd/ 347
METRIC RANK
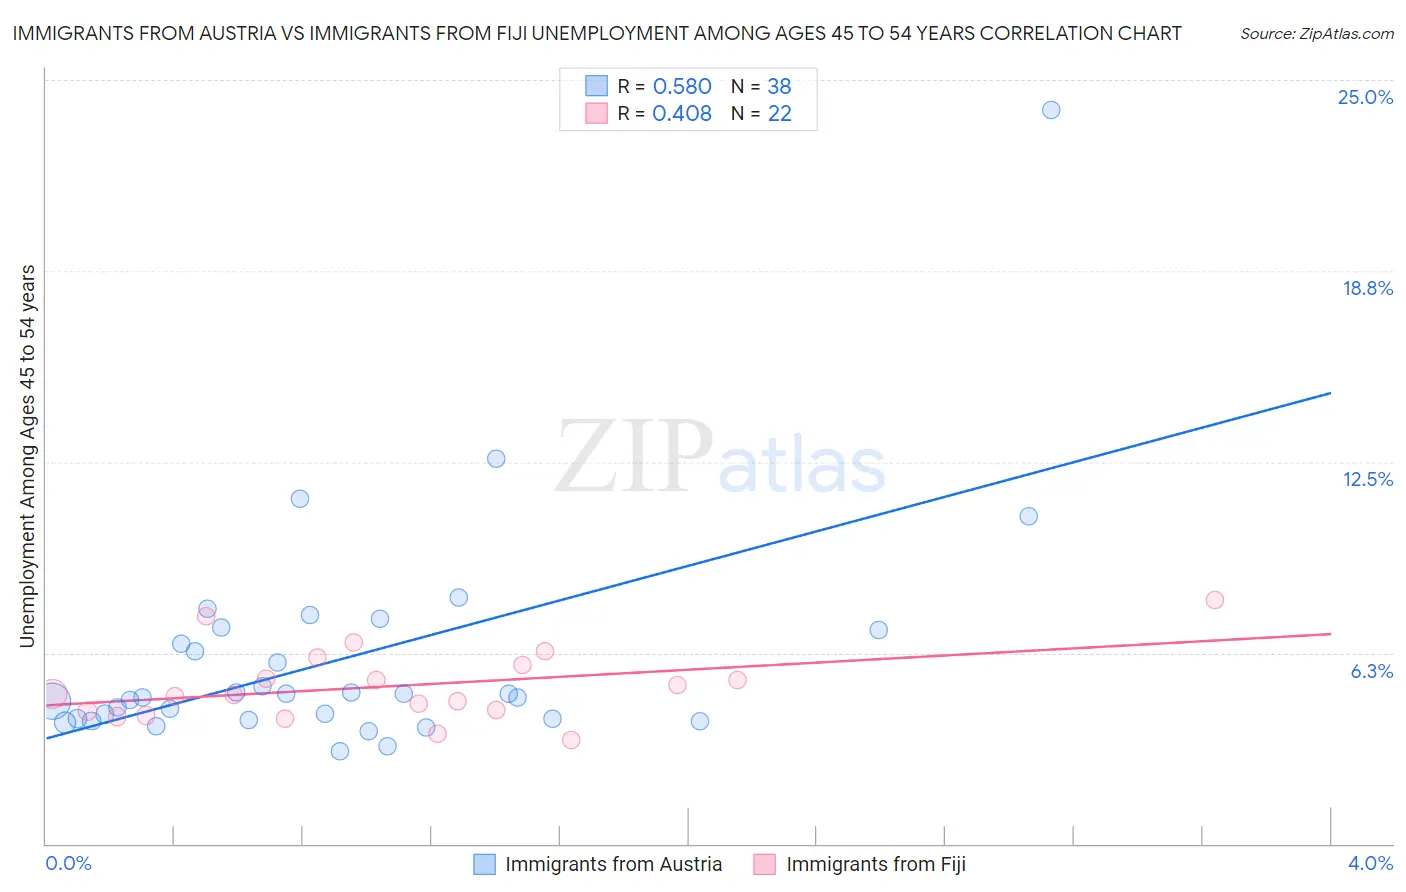
Immigrants from Austria vs Immigrants from Fiji Unemployment Among Ages 45 to 54 years Correlation Chart
The statistical analysis conducted on geographies consisting of 165,784,372 people shows a substantial positive correlation between the proportion of Immigrants from Austria and unemployment rate among population between the ages 45 and 54 in the United States with a correlation coefficient (R) of 0.580 and weighted average of 4.5%. Similarly, the statistical analysis conducted on geographies consisting of 93,345,757 people shows a moderate positive correlation between the proportion of Immigrants from Fiji and unemployment rate among population between the ages 45 and 54 in the United States with a correlation coefficient (R) of 0.408 and weighted average of 4.9%, a difference of 9.7%.
Unemployment Among Ages 45 to 54 years Correlation Summary
| Measurement | Immigrants from Austria | Immigrants from Fiji |
| Minimum | 3.0% | 3.4% |
| Maximum | 24.0% | 8.0% |
| Range | 21.0% | 4.6% |
| Mean | 6.1% | 5.2% |
| Median | 4.9% | 4.9% |
| Interquartile 25% (IQ1) | 4.1% | 4.3% |
| Interquartile 75% (IQ3) | 7.0% | 5.9% |
| Interquartile Range (IQR) | 2.9% | 1.5% |
| Standard Deviation (Sample) | 3.7% | 1.2% |
| Standard Deviation (Population) | 3.7% | 1.1% |
Similar Demographics by Unemployment Among Ages 45 to 54 years
Demographics Similar to Immigrants from Austria by Unemployment Among Ages 45 to 54 years
In terms of unemployment among ages 45 to 54 years, the demographic groups most similar to Immigrants from Austria are Costa Rican (4.5%, a difference of 0.0%), Tsimshian (4.5%, a difference of 0.040%), Cypriot (4.5%, a difference of 0.060%), Uruguayan (4.5%, a difference of 0.10%), and Syrian (4.5%, a difference of 0.13%).
| Demographics | Rating | Rank | Unemployment Among Ages 45 to 54 years |
| Immigrants | Afghanistan | 79.6 /100 | #141 | Good 4.4% |
| Immigrants | Netherlands | 79.4 /100 | #142 | Good 4.4% |
| Macedonians | 79.0 /100 | #143 | Good 4.5% |
| Taiwanese | 77.9 /100 | #144 | Good 4.5% |
| Immigrants | Latvia | 77.5 /100 | #145 | Good 4.5% |
| Syrians | 77.3 /100 | #146 | Good 4.5% |
| Uruguayans | 76.9 /100 | #147 | Good 4.5% |
| Immigrants | Austria | 75.3 /100 | #148 | Good 4.5% |
| Costa Ricans | 75.3 /100 | #149 | Good 4.5% |
| Tsimshian | 74.6 /100 | #150 | Good 4.5% |
| Cypriots | 74.4 /100 | #151 | Good 4.5% |
| Koreans | 73.1 /100 | #152 | Good 4.5% |
| Hungarians | 73.0 /100 | #153 | Good 4.5% |
| Immigrants | Spain | 72.5 /100 | #154 | Good 4.5% |
| Marshallese | 70.6 /100 | #155 | Good 4.5% |
Demographics Similar to Immigrants from Fiji by Unemployment Among Ages 45 to 54 years
In terms of unemployment among ages 45 to 54 years, the demographic groups most similar to Immigrants from Fiji are Immigrants from Guatemala (4.9%, a difference of 0.26%), Mexican (4.9%, a difference of 0.40%), Immigrants from Somalia (4.9%, a difference of 0.53%), Mexican American Indian (4.9%, a difference of 0.64%), and Guatemalan (4.9%, a difference of 0.64%).
| Demographics | Rating | Rank | Unemployment Among Ages 45 to 54 years |
| Immigrants | Western Asia | 0.2 /100 | #256 | Tragic 4.8% |
| Immigrants | Western Africa | 0.2 /100 | #257 | Tragic 4.9% |
| Sub-Saharan Africans | 0.2 /100 | #258 | Tragic 4.9% |
| Ugandans | 0.1 /100 | #259 | Tragic 4.9% |
| Mexican American Indians | 0.1 /100 | #260 | Tragic 4.9% |
| Guatemalans | 0.1 /100 | #261 | Tragic 4.9% |
| Mexicans | 0.1 /100 | #262 | Tragic 4.9% |
| Immigrants | Fiji | 0.1 /100 | #263 | Tragic 4.9% |
| Immigrants | Guatemala | 0.1 /100 | #264 | Tragic 4.9% |
| Immigrants | Somalia | 0.1 /100 | #265 | Tragic 4.9% |
| Ghanaians | 0.0 /100 | #266 | Tragic 4.9% |
| Bahamians | 0.0 /100 | #267 | Tragic 4.9% |
| Immigrants | Uzbekistan | 0.0 /100 | #268 | Tragic 4.9% |
| Somalis | 0.0 /100 | #269 | Tragic 5.0% |
| Immigrants | Ghana | 0.0 /100 | #270 | Tragic 5.0% |