Immigrants from Austria vs Bulgarian Unemployment Among Ages 60 to 64 years
COMPARE
Immigrants from Austria
Bulgarian
Unemployment Among Ages 60 to 64 years
Unemployment Among Ages 60 to 64 years Comparison
Immigrants from Austria
Bulgarians
4.9%
UNEMPLOYMENT AMONG AGES 60 TO 64 YEARS
26.6/ 100
METRIC RATING
195th/ 347
METRIC RANK
4.7%
UNEMPLOYMENT AMONG AGES 60 TO 64 YEARS
96.6/ 100
METRIC RATING
113th/ 347
METRIC RANK
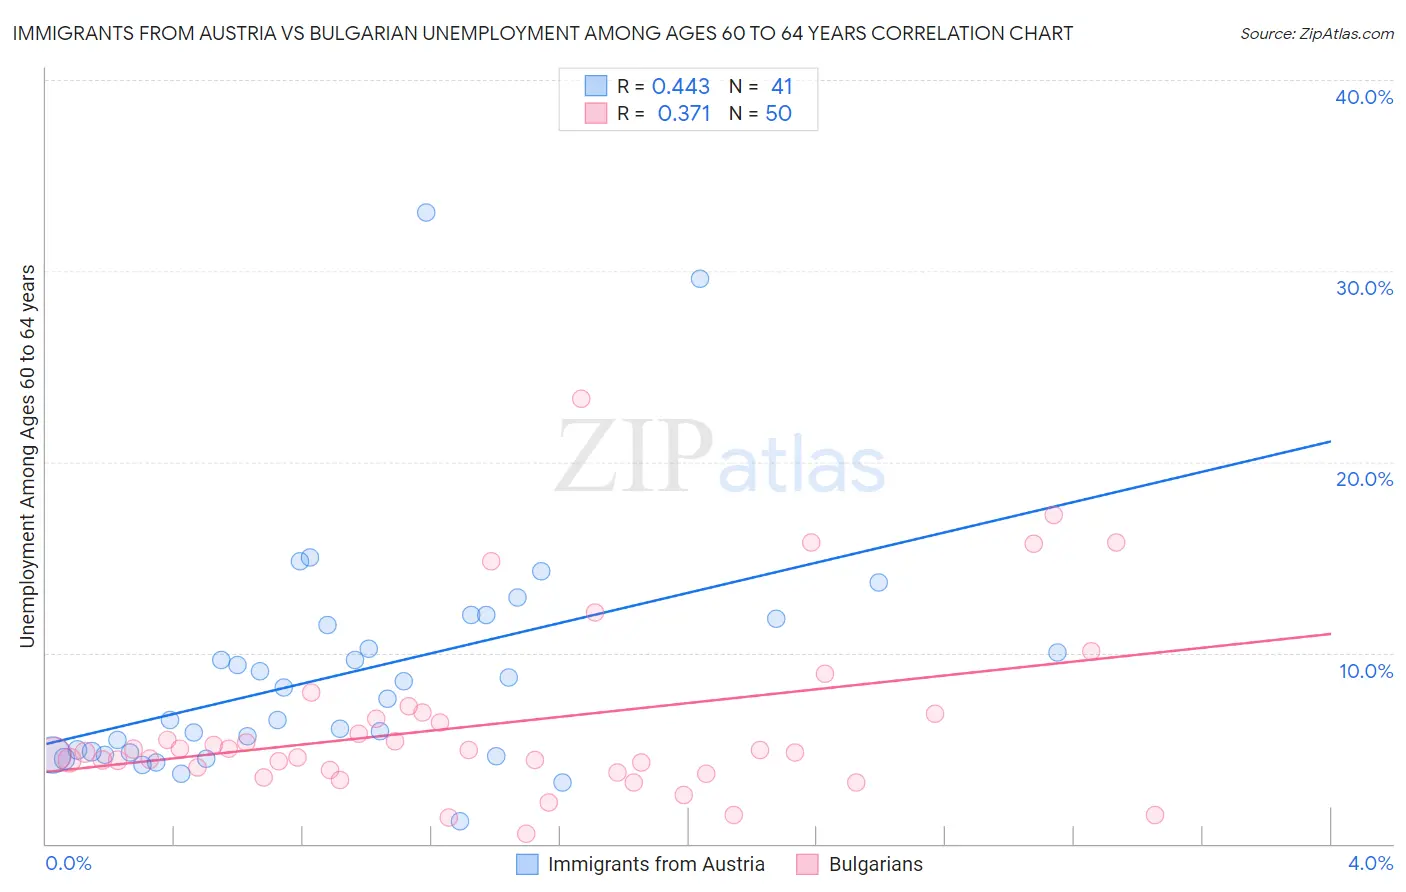
Immigrants from Austria vs Bulgarian Unemployment Among Ages 60 to 64 years Correlation Chart
The statistical analysis conducted on geographies consisting of 161,133,205 people shows a moderate positive correlation between the proportion of Immigrants from Austria and unemployment rate among population between the ages 60 and 64 in the United States with a correlation coefficient (R) of 0.443 and weighted average of 4.9%. Similarly, the statistical analysis conducted on geographies consisting of 195,290,178 people shows a mild positive correlation between the proportion of Bulgarians and unemployment rate among population between the ages 60 and 64 in the United States with a correlation coefficient (R) of 0.371 and weighted average of 4.7%, a difference of 4.0%.
Unemployment Among Ages 60 to 64 years Correlation Summary
| Measurement | Immigrants from Austria | Bulgarian |
| Minimum | 1.2% | 0.50% |
| Maximum | 33.1% | 23.3% |
| Range | 31.9% | 22.8% |
| Mean | 8.9% | 6.3% |
| Median | 7.6% | 4.9% |
| Interquartile 25% (IQ1) | 4.7% | 3.8% |
| Interquartile 75% (IQ3) | 11.6% | 6.8% |
| Interquartile Range (IQR) | 6.9% | 3.0% |
| Standard Deviation (Sample) | 6.2% | 4.6% |
| Standard Deviation (Population) | 6.2% | 4.6% |
Similar Demographics by Unemployment Among Ages 60 to 64 years
Demographics Similar to Immigrants from Austria by Unemployment Among Ages 60 to 64 years
In terms of unemployment among ages 60 to 64 years, the demographic groups most similar to Immigrants from Austria are Immigrants from Colombia (4.9%, a difference of 0.010%), Immigrants from Asia (4.9%, a difference of 0.040%), Immigrants from Eastern Europe (4.9%, a difference of 0.070%), Houma (4.9%, a difference of 0.080%), and Menominee (4.9%, a difference of 0.10%).
| Demographics | Rating | Rank | Unemployment Among Ages 60 to 64 years |
| Nicaraguans | 30.4 /100 | #188 | Fair 4.9% |
| Immigrants | Nicaragua | 29.8 /100 | #189 | Fair 4.9% |
| Immigrants | Europe | 29.8 /100 | #190 | Fair 4.9% |
| Immigrants | Nigeria | 29.6 /100 | #191 | Fair 4.9% |
| Menominee | 28.8 /100 | #192 | Fair 4.9% |
| Houma | 28.3 /100 | #193 | Fair 4.9% |
| Immigrants | Colombia | 26.8 /100 | #194 | Fair 4.9% |
| Immigrants | Austria | 26.6 /100 | #195 | Fair 4.9% |
| Immigrants | Asia | 25.7 /100 | #196 | Fair 4.9% |
| Immigrants | Eastern Europe | 25.2 /100 | #197 | Fair 4.9% |
| Guamanians/Chamorros | 23.7 /100 | #198 | Fair 4.9% |
| Immigrants | Vietnam | 23.7 /100 | #199 | Fair 4.9% |
| Immigrants | Czechoslovakia | 23.5 /100 | #200 | Fair 4.9% |
| Colombians | 22.7 /100 | #201 | Fair 4.9% |
| Immigrants | Western Africa | 20.6 /100 | #202 | Fair 4.9% |
Demographics Similar to Bulgarians by Unemployment Among Ages 60 to 64 years
In terms of unemployment among ages 60 to 64 years, the demographic groups most similar to Bulgarians are Maltese (4.7%, a difference of 0.0%), Immigrants from Romania (4.7%, a difference of 0.030%), Immigrants from England (4.7%, a difference of 0.070%), Immigrants from Germany (4.7%, a difference of 0.070%), and Syrian (4.7%, a difference of 0.12%).
| Demographics | Rating | Rank | Unemployment Among Ages 60 to 64 years |
| Immigrants | North America | 97.6 /100 | #106 | Exceptional 4.7% |
| Greeks | 97.5 /100 | #107 | Exceptional 4.7% |
| Immigrants | Japan | 97.4 /100 | #108 | Exceptional 4.7% |
| Immigrants | Netherlands | 97.4 /100 | #109 | Exceptional 4.7% |
| Ethiopians | 97.2 /100 | #110 | Exceptional 4.7% |
| French | 97.1 /100 | #111 | Exceptional 4.7% |
| Syrians | 97.0 /100 | #112 | Exceptional 4.7% |
| Bulgarians | 96.6 /100 | #113 | Exceptional 4.7% |
| Maltese | 96.5 /100 | #114 | Exceptional 4.7% |
| Immigrants | Romania | 96.4 /100 | #115 | Exceptional 4.7% |
| Immigrants | England | 96.3 /100 | #116 | Exceptional 4.7% |
| Immigrants | Germany | 96.3 /100 | #117 | Exceptional 4.7% |
| Ukrainians | 96.1 /100 | #118 | Exceptional 4.7% |
| Immigrants | Morocco | 95.7 /100 | #119 | Exceptional 4.7% |
| Macedonians | 95.7 /100 | #120 | Exceptional 4.7% |