Immigrants from Asia vs Tsimshian Unemployment Among Ages 65 to 74 years
COMPARE
Immigrants from Asia
Tsimshian
Unemployment Among Ages 65 to 74 years
Unemployment Among Ages 65 to 74 years Comparison
Immigrants from Asia
Tsimshian
5.3%
UNEMPLOYMENT AMONG AGES 65 TO 74 YEARS
78.4/ 100
METRIC RATING
141st/ 347
METRIC RANK
4.6%
UNEMPLOYMENT AMONG AGES 65 TO 74 YEARS
100.0/ 100
METRIC RATING
4th/ 347
METRIC RANK
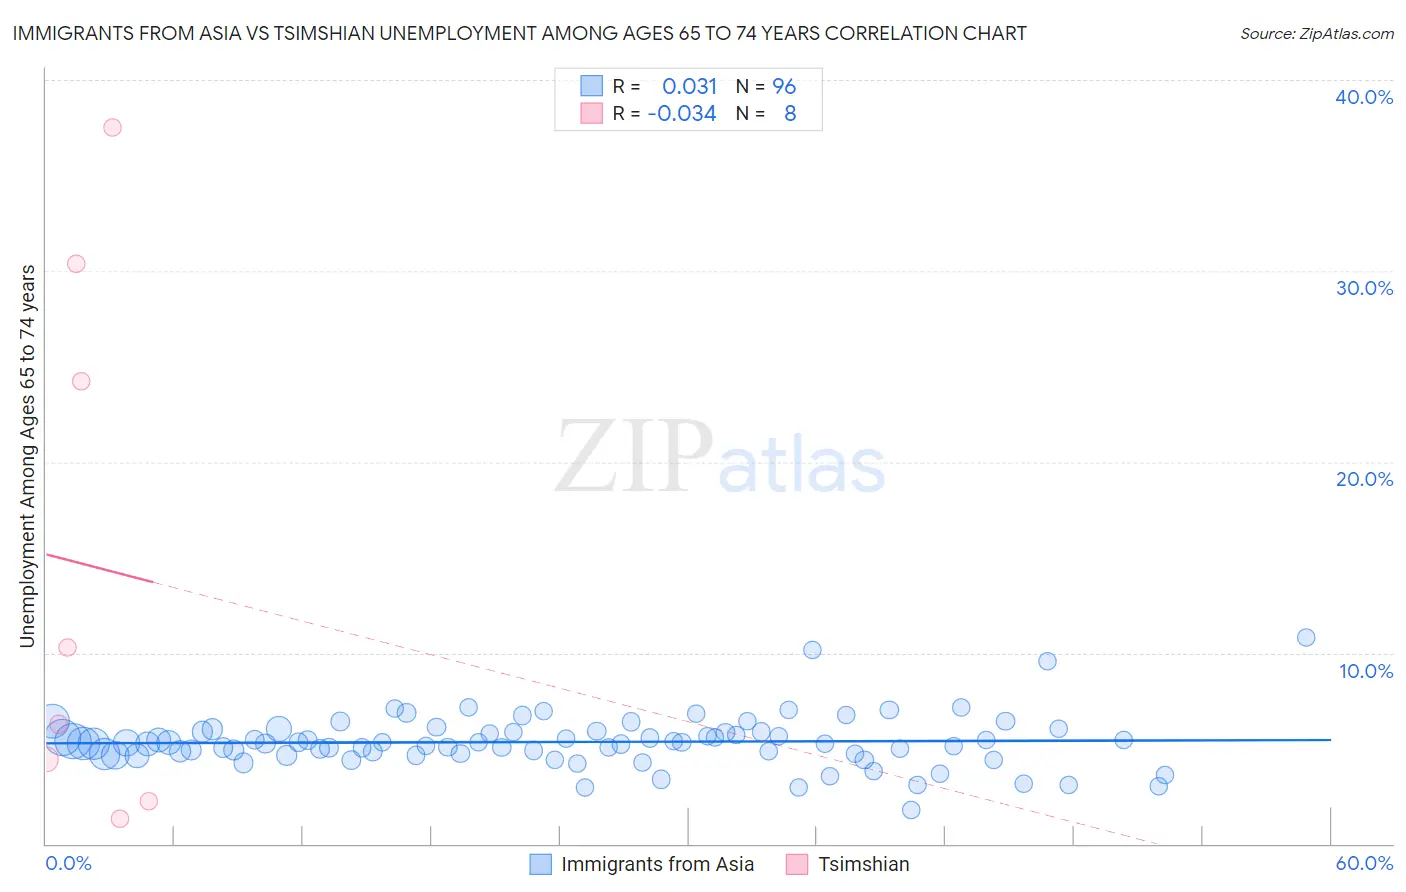
Immigrants from Asia vs Tsimshian Unemployment Among Ages 65 to 74 years Correlation Chart
The statistical analysis conducted on geographies consisting of 441,194,838 people shows no correlation between the proportion of Immigrants from Asia and unemployment rate among population between the ages 65 and 74 in the United States with a correlation coefficient (R) of 0.031 and weighted average of 5.3%. Similarly, the statistical analysis conducted on geographies consisting of 14,901,879 people shows no correlation between the proportion of Tsimshian and unemployment rate among population between the ages 65 and 74 in the United States with a correlation coefficient (R) of -0.034 and weighted average of 4.6%, a difference of 15.8%.
Unemployment Among Ages 65 to 74 years Correlation Summary
| Measurement | Immigrants from Asia | Tsimshian |
| Minimum | 1.8% | 1.3% |
| Maximum | 10.8% | 37.5% |
| Range | 9.0% | 36.2% |
| Mean | 5.3% | 14.6% |
| Median | 5.3% | 8.3% |
| Interquartile 25% (IQ1) | 4.7% | 3.3% |
| Interquartile 75% (IQ3) | 5.9% | 27.3% |
| Interquartile Range (IQR) | 1.2% | 24.0% |
| Standard Deviation (Sample) | 1.4% | 14.1% |
| Standard Deviation (Population) | 1.4% | 13.2% |
Similar Demographics by Unemployment Among Ages 65 to 74 years
Demographics Similar to Immigrants from Asia by Unemployment Among Ages 65 to 74 years
In terms of unemployment among ages 65 to 74 years, the demographic groups most similar to Immigrants from Asia are Immigrants from Laos (5.3%, a difference of 0.010%), Finnish (5.3%, a difference of 0.030%), Chilean (5.3%, a difference of 0.070%), Turkish (5.3%, a difference of 0.11%), and New Zealander (5.3%, a difference of 0.11%).
| Demographics | Rating | Rank | Unemployment Among Ages 65 to 74 years |
| Immigrants | Panama | 81.8 /100 | #134 | Excellent 5.3% |
| Immigrants | Serbia | 81.8 /100 | #135 | Excellent 5.3% |
| Celtics | 80.8 /100 | #136 | Excellent 5.3% |
| Immigrants | Afghanistan | 80.8 /100 | #137 | Excellent 5.3% |
| Chileans | 79.7 /100 | #138 | Good 5.3% |
| Finns | 79.0 /100 | #139 | Good 5.3% |
| Immigrants | Laos | 78.6 /100 | #140 | Good 5.3% |
| Immigrants | Asia | 78.4 /100 | #141 | Good 5.3% |
| Turks | 76.2 /100 | #142 | Good 5.3% |
| New Zealanders | 76.1 /100 | #143 | Good 5.3% |
| Immigrants | Chile | 76.0 /100 | #144 | Good 5.3% |
| Canadians | 75.0 /100 | #145 | Good 5.3% |
| Irish | 74.8 /100 | #146 | Good 5.3% |
| Immigrants | Latvia | 74.6 /100 | #147 | Good 5.3% |
| Immigrants | Sri Lanka | 73.8 /100 | #148 | Good 5.3% |
Demographics Similar to Tsimshian by Unemployment Among Ages 65 to 74 years
In terms of unemployment among ages 65 to 74 years, the demographic groups most similar to Tsimshian are Sudanese (4.6%, a difference of 0.36%), Immigrants from Cuba (4.6%, a difference of 0.88%), Fijian (4.5%, a difference of 1.5%), Indonesian (4.7%, a difference of 2.3%), and Comanche (4.7%, a difference of 2.5%).
| Demographics | Rating | Rank | Unemployment Among Ages 65 to 74 years |
| Hmong | 100.0 /100 | #1 | Exceptional 4.2% |
| Chinese | 100.0 /100 | #2 | Exceptional 4.4% |
| Fijians | 100.0 /100 | #3 | Exceptional 4.5% |
| Tsimshian | 100.0 /100 | #4 | Exceptional 4.6% |
| Sudanese | 100.0 /100 | #5 | Exceptional 4.6% |
| Immigrants | Cuba | 100.0 /100 | #6 | Exceptional 4.6% |
| Indonesians | 100.0 /100 | #7 | Exceptional 4.7% |
| Comanche | 100.0 /100 | #8 | Exceptional 4.7% |
| Chickasaw | 100.0 /100 | #9 | Exceptional 4.7% |
| Osage | 100.0 /100 | #10 | Exceptional 4.7% |
| Immigrants | Congo | 100.0 /100 | #11 | Exceptional 4.7% |
| Tongans | 100.0 /100 | #12 | Exceptional 4.7% |
| Lumbee | 100.0 /100 | #13 | Exceptional 4.8% |
| Cubans | 100.0 /100 | #14 | Exceptional 4.8% |
| Immigrants | North Macedonia | 100.0 /100 | #15 | Exceptional 4.8% |