Immigrants from Afghanistan vs Nicaraguan Unemployment Among Ages 45 to 54 years
COMPARE
Immigrants from Afghanistan
Nicaraguan
Unemployment Among Ages 45 to 54 years
Unemployment Among Ages 45 to 54 years Comparison
Immigrants from Afghanistan
Nicaraguans
4.4%
UNEMPLOYMENT AMONG AGES 45 TO 54 YEARS
79.6/ 100
METRIC RATING
141st/ 347
METRIC RANK
4.4%
UNEMPLOYMENT AMONG AGES 45 TO 54 YEARS
87.6/ 100
METRIC RATING
127th/ 347
METRIC RANK
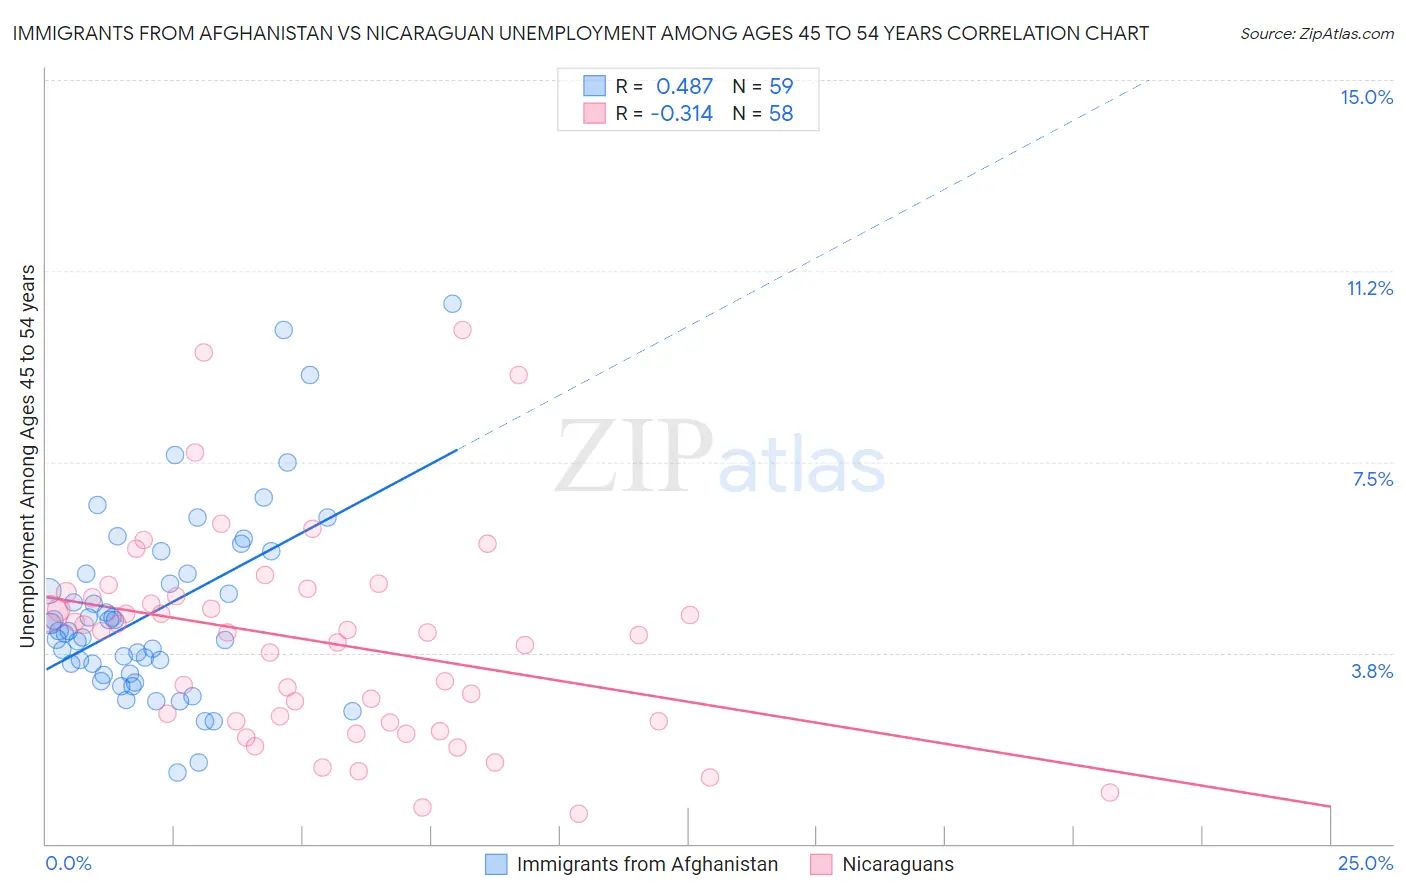
Immigrants from Afghanistan vs Nicaraguan Unemployment Among Ages 45 to 54 years Correlation Chart
The statistical analysis conducted on geographies consisting of 146,637,469 people shows a moderate positive correlation between the proportion of Immigrants from Afghanistan and unemployment rate among population between the ages 45 and 54 in the United States with a correlation coefficient (R) of 0.487 and weighted average of 4.4%. Similarly, the statistical analysis conducted on geographies consisting of 282,332,859 people shows a mild negative correlation between the proportion of Nicaraguans and unemployment rate among population between the ages 45 and 54 in the United States with a correlation coefficient (R) of -0.314 and weighted average of 4.4%, a difference of 0.71%.
Unemployment Among Ages 45 to 54 years Correlation Summary
| Measurement | Immigrants from Afghanistan | Nicaraguan |
| Minimum | 1.4% | 0.60% |
| Maximum | 10.6% | 10.1% |
| Range | 9.2% | 9.5% |
| Mean | 4.6% | 4.0% |
| Median | 4.2% | 4.2% |
| Interquartile 25% (IQ1) | 3.3% | 2.4% |
| Interquartile 75% (IQ3) | 5.3% | 4.9% |
| Interquartile Range (IQR) | 2.0% | 2.5% |
| Standard Deviation (Sample) | 1.8% | 2.0% |
| Standard Deviation (Population) | 1.8% | 2.0% |
Demographics Similar to Immigrants from Afghanistan and Nicaraguans by Unemployment Among Ages 45 to 54 years
In terms of unemployment among ages 45 to 54 years, the demographic groups most similar to Immigrants from Afghanistan are Immigrants from Netherlands (4.4%, a difference of 0.020%), Macedonian (4.5%, a difference of 0.040%), Immigrants from Zaire (4.4%, a difference of 0.080%), Taiwanese (4.5%, a difference of 0.12%), and Immigrants from Congo (4.4%, a difference of 0.16%). Similarly, the demographic groups most similar to Nicaraguans are Immigrants from Czechoslovakia (4.4%, a difference of 0.010%), Immigrants from Northern Europe (4.4%, a difference of 0.080%), Immigrants from Vietnam (4.4%, a difference of 0.11%), Spanish (4.4%, a difference of 0.13%), and Laotian (4.4%, a difference of 0.14%).
| Demographics | Rating | Rank | Unemployment Among Ages 45 to 54 years |
| Spanish | 88.8 /100 | #124 | Excellent 4.4% |
| Immigrants | Vietnam | 88.6 /100 | #125 | Excellent 4.4% |
| Immigrants | Czechoslovakia | 87.8 /100 | #126 | Excellent 4.4% |
| Nicaraguans | 87.6 /100 | #127 | Excellent 4.4% |
| Immigrants | Northern Europe | 86.9 /100 | #128 | Excellent 4.4% |
| Laotians | 86.3 /100 | #129 | Excellent 4.4% |
| Celtics | 86.2 /100 | #130 | Excellent 4.4% |
| Immigrants | Germany | 85.9 /100 | #131 | Excellent 4.4% |
| Immigrants | Eastern Africa | 85.1 /100 | #132 | Excellent 4.4% |
| Immigrants | Cameroon | 84.8 /100 | #133 | Excellent 4.4% |
| Afghans | 84.6 /100 | #134 | Excellent 4.4% |
| Immigrants | Eastern Asia | 84.0 /100 | #135 | Excellent 4.4% |
| Immigrants | Middle Africa | 83.3 /100 | #136 | Excellent 4.4% |
| Lebanese | 81.9 /100 | #137 | Excellent 4.4% |
| Immigrants | Congo | 81.8 /100 | #138 | Excellent 4.4% |
| Immigrants | Kuwait | 81.7 /100 | #139 | Excellent 4.4% |
| Immigrants | Zaire | 80.7 /100 | #140 | Excellent 4.4% |
| Immigrants | Afghanistan | 79.6 /100 | #141 | Good 4.4% |
| Immigrants | Netherlands | 79.4 /100 | #142 | Good 4.4% |
| Macedonians | 79.0 /100 | #143 | Good 4.5% |
| Taiwanese | 77.9 /100 | #144 | Good 4.5% |