Hungarian vs Immigrants from Zaire Unemployment Among Ages 25 to 29 years
COMPARE
Hungarian
Immigrants from Zaire
Unemployment Among Ages 25 to 29 years
Unemployment Among Ages 25 to 29 years Comparison
Hungarians
Immigrants from Zaire
6.8%
UNEMPLOYMENT AMONG AGES 25 TO 29 YEARS
26.8/ 100
METRIC RATING
196th/ 347
METRIC RANK
6.0%
UNEMPLOYMENT AMONG AGES 25 TO 29 YEARS
99.7/ 100
METRIC RATING
27th/ 347
METRIC RANK
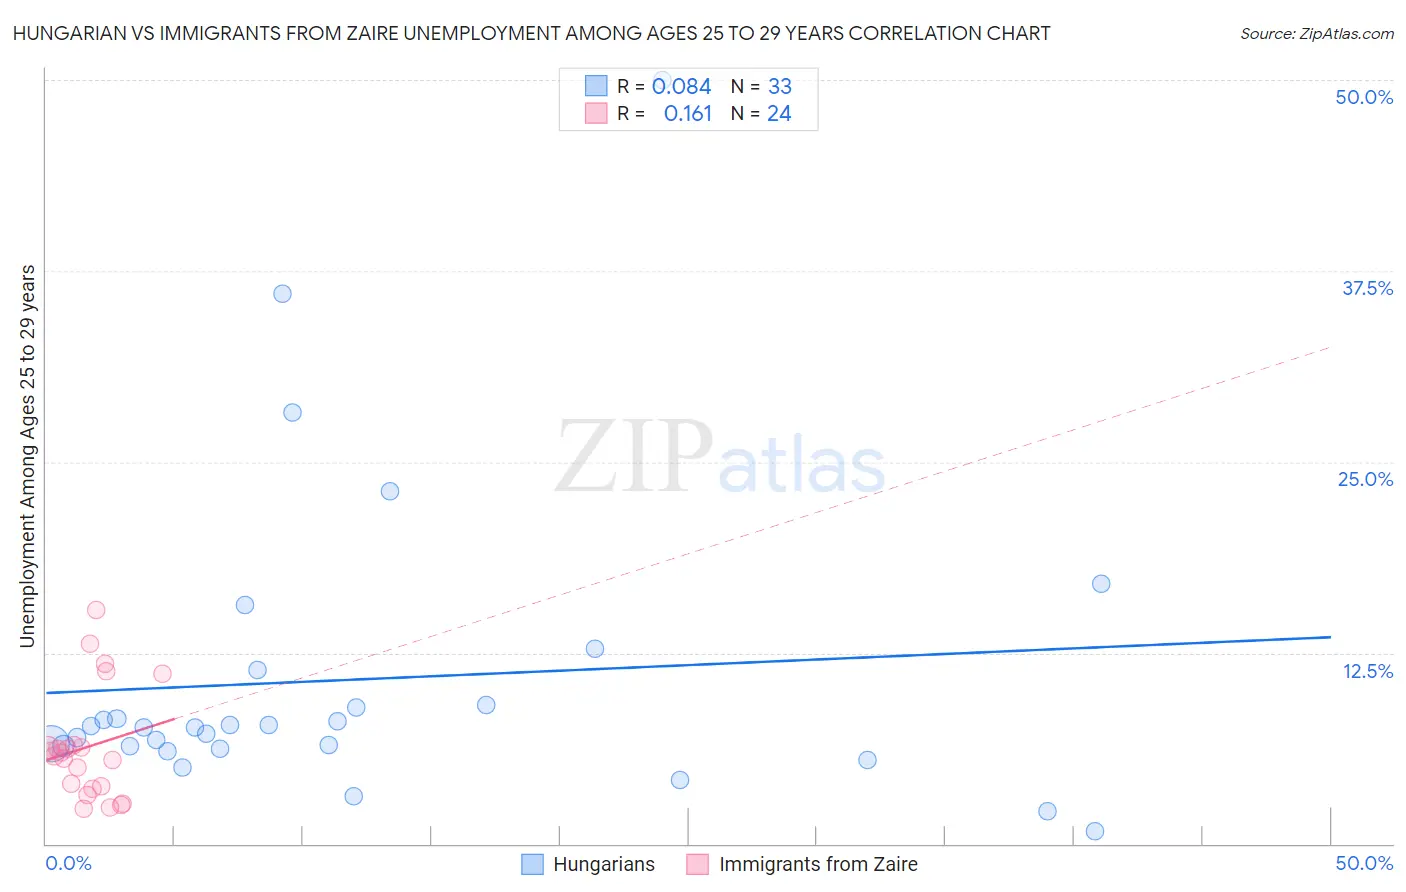
Hungarian vs Immigrants from Zaire Unemployment Among Ages 25 to 29 years Correlation Chart
The statistical analysis conducted on geographies consisting of 447,409,304 people shows a slight positive correlation between the proportion of Hungarians and unemployment rate among population between the ages 25 and 29 in the United States with a correlation coefficient (R) of 0.084 and weighted average of 6.8%. Similarly, the statistical analysis conducted on geographies consisting of 105,842,243 people shows a poor positive correlation between the proportion of Immigrants from Zaire and unemployment rate among population between the ages 25 and 29 in the United States with a correlation coefficient (R) of 0.161 and weighted average of 6.0%, a difference of 11.8%.
Unemployment Among Ages 25 to 29 years Correlation Summary
| Measurement | Hungarian | Immigrants from Zaire |
| Minimum | 0.80% | 2.3% |
| Maximum | 50.0% | 15.3% |
| Range | 49.2% | 13.1% |
| Mean | 10.8% | 6.3% |
| Median | 7.6% | 5.8% |
| Interquartile 25% (IQ1) | 6.3% | 3.7% |
| Interquartile 75% (IQ3) | 10.3% | 6.4% |
| Interquartile Range (IQR) | 4.0% | 2.7% |
| Standard Deviation (Sample) | 10.1% | 3.6% |
| Standard Deviation (Population) | 10.0% | 3.5% |
Similar Demographics by Unemployment Among Ages 25 to 29 years
Demographics Similar to Hungarians by Unemployment Among Ages 25 to 29 years
In terms of unemployment among ages 25 to 29 years, the demographic groups most similar to Hungarians are Italian (6.8%, a difference of 0.020%), Immigrants from Western Asia (6.7%, a difference of 0.040%), Alsatian (6.7%, a difference of 0.10%), Immigrants from Greece (6.7%, a difference of 0.10%), and Immigrants from Ukraine (6.7%, a difference of 0.14%).
| Demographics | Rating | Rank | Unemployment Among Ages 25 to 29 years |
| Argentineans | 32.1 /100 | #189 | Fair 6.7% |
| Koreans | 29.3 /100 | #190 | Fair 6.7% |
| Chickasaw | 28.7 /100 | #191 | Fair 6.7% |
| Immigrants | Ukraine | 28.6 /100 | #192 | Fair 6.7% |
| Alsatians | 28.1 /100 | #193 | Fair 6.7% |
| Immigrants | Greece | 28.0 /100 | #194 | Fair 6.7% |
| Immigrants | Western Asia | 27.3 /100 | #195 | Fair 6.7% |
| Hungarians | 26.8 /100 | #196 | Fair 6.8% |
| Italians | 26.5 /100 | #197 | Fair 6.8% |
| Immigrants | Southern Europe | 24.6 /100 | #198 | Fair 6.8% |
| Guamanians/Chamorros | 24.3 /100 | #199 | Fair 6.8% |
| South American Indians | 23.3 /100 | #200 | Fair 6.8% |
| Basques | 22.5 /100 | #201 | Fair 6.8% |
| Immigrants | Argentina | 21.6 /100 | #202 | Fair 6.8% |
| Immigrants | Norway | 21.2 /100 | #203 | Fair 6.8% |
Demographics Similar to Immigrants from Zaire by Unemployment Among Ages 25 to 29 years
In terms of unemployment among ages 25 to 29 years, the demographic groups most similar to Immigrants from Zaire are Danish (6.0%, a difference of 0.050%), Immigrants from Eastern Africa (6.0%, a difference of 0.12%), New Zealander (6.0%, a difference of 0.20%), Immigrants from South Central Asia (6.1%, a difference of 0.23%), and Bulgarian (6.1%, a difference of 0.34%).
| Demographics | Rating | Rank | Unemployment Among Ages 25 to 29 years |
| Immigrants | Eritrea | 99.9 /100 | #20 | Exceptional 5.9% |
| Immigrants | Ethiopia | 99.9 /100 | #21 | Exceptional 6.0% |
| Immigrants | Japan | 99.9 /100 | #22 | Exceptional 6.0% |
| Immigrants | Venezuela | 99.8 /100 | #23 | Exceptional 6.0% |
| Norwegians | 99.8 /100 | #24 | Exceptional 6.0% |
| New Zealanders | 99.8 /100 | #25 | Exceptional 6.0% |
| Immigrants | Eastern Africa | 99.8 /100 | #26 | Exceptional 6.0% |
| Immigrants | Zaire | 99.7 /100 | #27 | Exceptional 6.0% |
| Danes | 99.7 /100 | #28 | Exceptional 6.0% |
| Immigrants | South Central Asia | 99.7 /100 | #29 | Exceptional 6.1% |
| Bulgarians | 99.7 /100 | #30 | Exceptional 6.1% |
| Filipinos | 99.7 /100 | #31 | Exceptional 6.1% |
| Chinese | 99.6 /100 | #32 | Exceptional 6.1% |
| Yugoslavians | 99.6 /100 | #33 | Exceptional 6.1% |
| Immigrants | Morocco | 99.5 /100 | #34 | Exceptional 6.1% |