Immigrants from Bosnia and Herzegovina vs Immigrants from Zaire Unemployment Among Ages 25 to 29 years
COMPARE
Immigrants from Bosnia and Herzegovina
Immigrants from Zaire
Unemployment Among Ages 25 to 29 years
Unemployment Among Ages 25 to 29 years Comparison
Immigrants from Bosnia and Herzegovina
Immigrants from Zaire
5.7%
UNEMPLOYMENT AMONG AGES 25 TO 29 YEARS
100.0/ 100
METRIC RATING
8th/ 347
METRIC RANK
6.0%
UNEMPLOYMENT AMONG AGES 25 TO 29 YEARS
99.7/ 100
METRIC RATING
27th/ 347
METRIC RANK
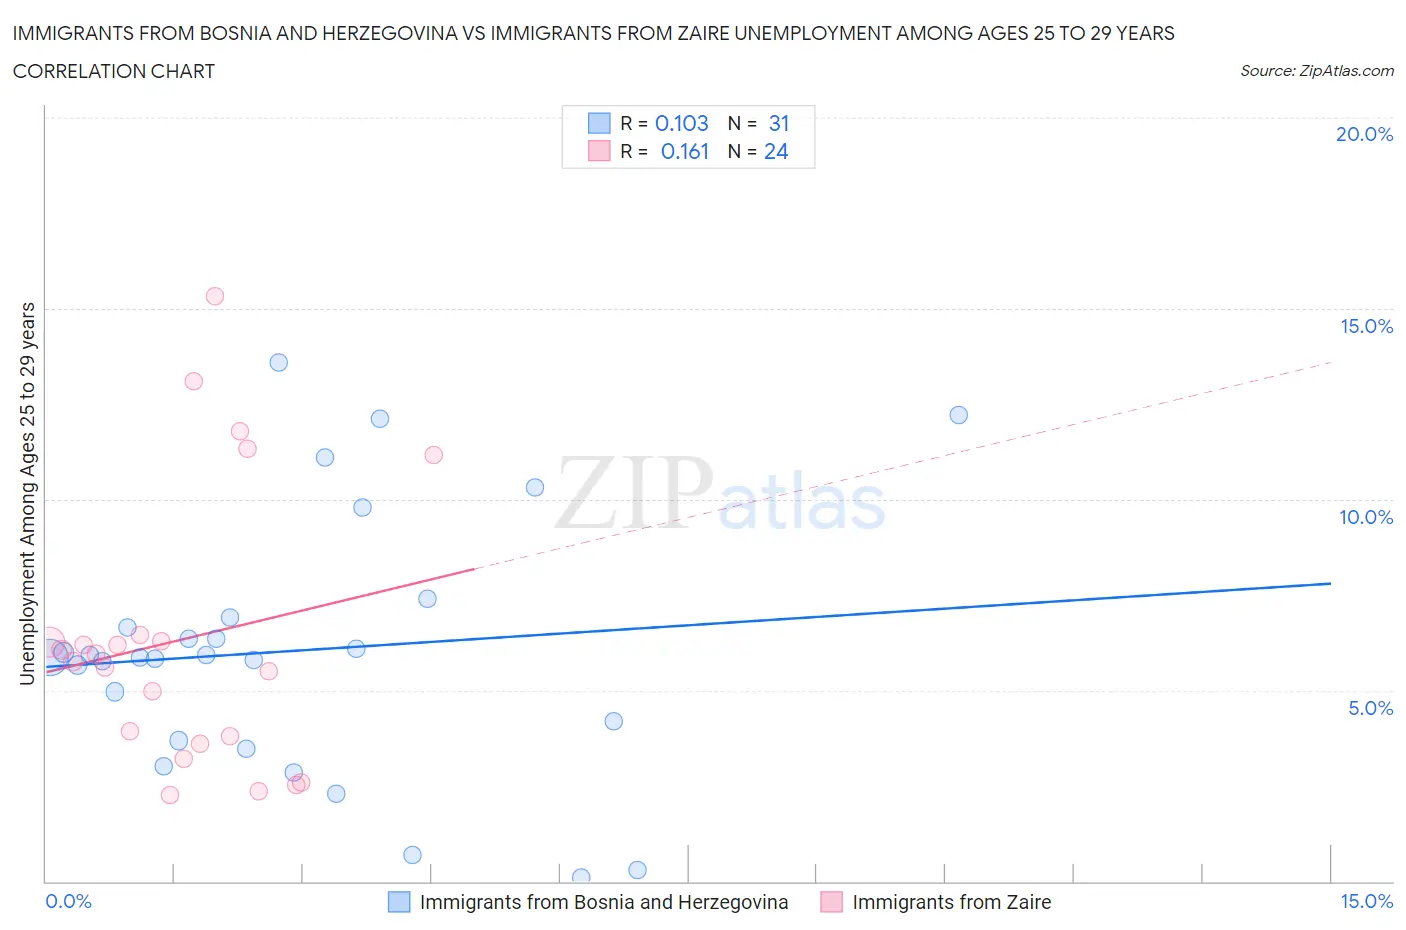
Immigrants from Bosnia and Herzegovina vs Immigrants from Zaire Unemployment Among Ages 25 to 29 years Correlation Chart
The statistical analysis conducted on geographies consisting of 153,450,530 people shows a poor positive correlation between the proportion of Immigrants from Bosnia and Herzegovina and unemployment rate among population between the ages 25 and 29 in the United States with a correlation coefficient (R) of 0.103 and weighted average of 5.7%. Similarly, the statistical analysis conducted on geographies consisting of 105,842,243 people shows a poor positive correlation between the proportion of Immigrants from Zaire and unemployment rate among population between the ages 25 and 29 in the United States with a correlation coefficient (R) of 0.161 and weighted average of 6.0%, a difference of 6.5%.
Unemployment Among Ages 25 to 29 years Correlation Summary
| Measurement | Immigrants from Bosnia and Herzegovina | Immigrants from Zaire |
| Minimum | 0.10% | 2.3% |
| Maximum | 13.6% | 15.3% |
| Range | 13.5% | 13.1% |
| Mean | 6.0% | 6.3% |
| Median | 5.9% | 5.8% |
| Interquartile 25% (IQ1) | 3.7% | 3.7% |
| Interquartile 75% (IQ3) | 6.9% | 6.4% |
| Interquartile Range (IQR) | 3.2% | 2.7% |
| Standard Deviation (Sample) | 3.4% | 3.6% |
| Standard Deviation (Population) | 3.3% | 3.5% |
Demographics Similar to Immigrants from Bosnia and Herzegovina and Immigrants from Zaire by Unemployment Among Ages 25 to 29 years
In terms of unemployment among ages 25 to 29 years, the demographic groups most similar to Immigrants from Bosnia and Herzegovina are Immigrants from India (5.7%, a difference of 0.12%), Immigrants from Nepal (5.7%, a difference of 1.3%), Immigrants from Sudan (5.8%, a difference of 2.0%), Cambodian (5.8%, a difference of 3.1%), and Okinawan (5.9%, a difference of 3.2%). Similarly, the demographic groups most similar to Immigrants from Zaire are Immigrants from Eastern Africa (6.0%, a difference of 0.12%), New Zealander (6.0%, a difference of 0.20%), Norwegian (6.0%, a difference of 0.83%), Immigrants from Venezuela (6.0%, a difference of 0.89%), and Immigrants from Japan (6.0%, a difference of 0.95%).
| Demographics | Rating | Rank | Unemployment Among Ages 25 to 29 years |
| Immigrants | India | 100.0 /100 | #7 | Exceptional 5.7% |
| Immigrants | Bosnia and Herzegovina | 100.0 /100 | #8 | Exceptional 5.7% |
| Immigrants | Nepal | 100.0 /100 | #9 | Exceptional 5.7% |
| Immigrants | Sudan | 100.0 /100 | #10 | Exceptional 5.8% |
| Cambodians | 100.0 /100 | #11 | Exceptional 5.8% |
| Okinawans | 100.0 /100 | #12 | Exceptional 5.9% |
| Immigrants | Bolivia | 100.0 /100 | #13 | Exceptional 5.9% |
| Immigrants | Kuwait | 99.9 /100 | #14 | Exceptional 5.9% |
| Cubans | 99.9 /100 | #15 | Exceptional 5.9% |
| Immigrants | Bulgaria | 99.9 /100 | #16 | Exceptional 5.9% |
| Bolivians | 99.9 /100 | #17 | Exceptional 5.9% |
| Immigrants | Singapore | 99.9 /100 | #18 | Exceptional 5.9% |
| Thais | 99.9 /100 | #19 | Exceptional 5.9% |
| Immigrants | Eritrea | 99.9 /100 | #20 | Exceptional 5.9% |
| Immigrants | Ethiopia | 99.9 /100 | #21 | Exceptional 6.0% |
| Immigrants | Japan | 99.9 /100 | #22 | Exceptional 6.0% |
| Immigrants | Venezuela | 99.8 /100 | #23 | Exceptional 6.0% |
| Norwegians | 99.8 /100 | #24 | Exceptional 6.0% |
| New Zealanders | 99.8 /100 | #25 | Exceptional 6.0% |
| Immigrants | Eastern Africa | 99.8 /100 | #26 | Exceptional 6.0% |
| Immigrants | Zaire | 99.7 /100 | #27 | Exceptional 6.0% |