Houma vs French Unemployment Among Ages 35 to 44 years
COMPARE
Houma
French
Unemployment Among Ages 35 to 44 years
Unemployment Among Ages 35 to 44 years Comparison
Houma
French
7.8%
UNEMPLOYMENT AMONG AGES 35 TO 44 YEARS
0.0/ 100
METRIC RATING
334th/ 347
METRIC RANK
4.7%
UNEMPLOYMENT AMONG AGES 35 TO 44 YEARS
55.6/ 100
METRIC RATING
166th/ 347
METRIC RANK
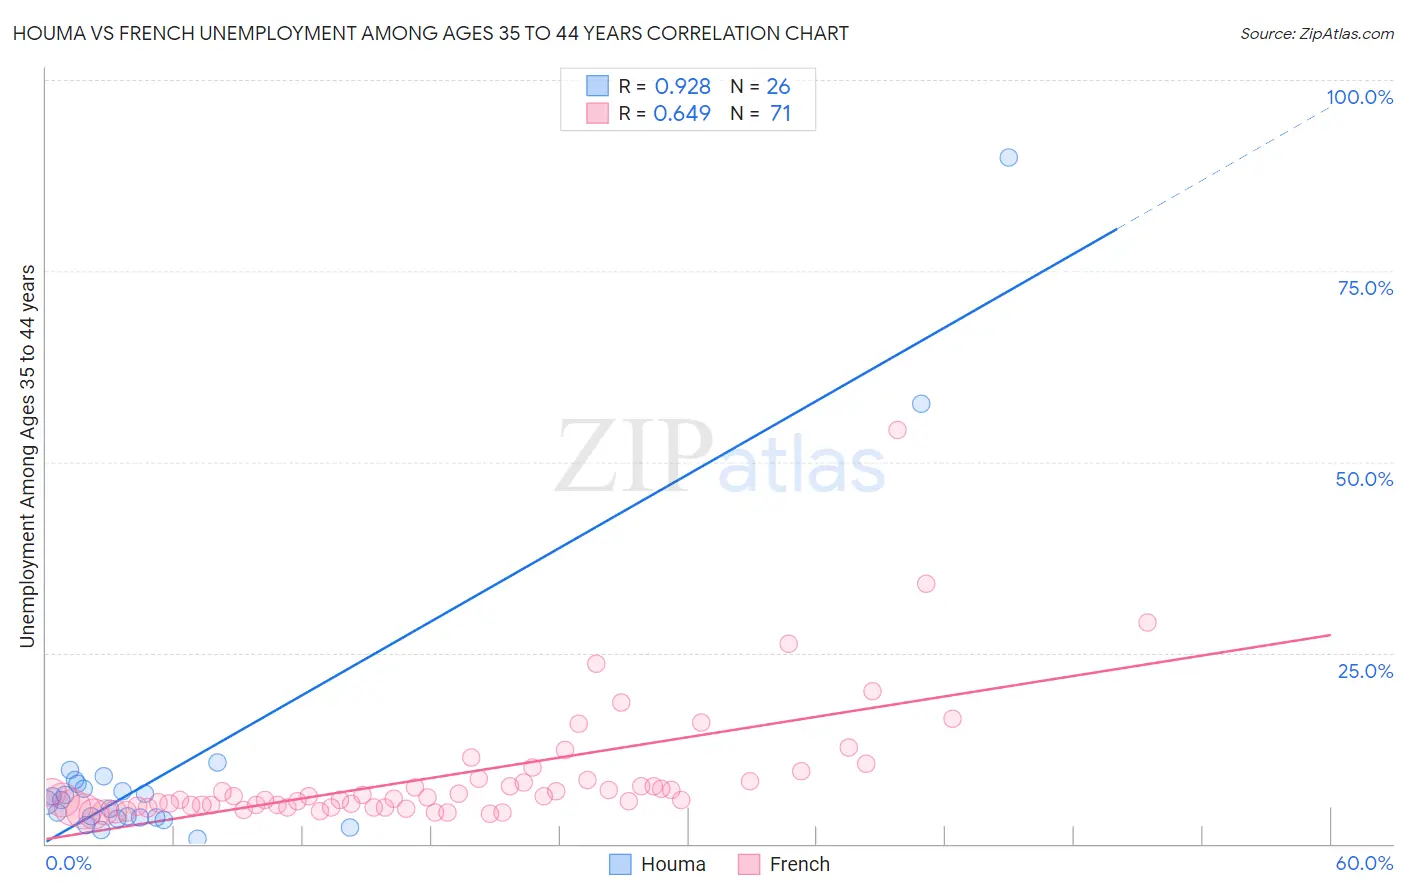
Houma vs French Unemployment Among Ages 35 to 44 years Correlation Chart
The statistical analysis conducted on geographies consisting of 36,511,243 people shows a near-perfect positive correlation between the proportion of Houma and unemployment rate among population between the ages 35 and 44 in the United States with a correlation coefficient (R) of 0.928 and weighted average of 7.8%. Similarly, the statistical analysis conducted on geographies consisting of 532,944,293 people shows a significant positive correlation between the proportion of French and unemployment rate among population between the ages 35 and 44 in the United States with a correlation coefficient (R) of 0.649 and weighted average of 4.7%, a difference of 67.8%.
Unemployment Among Ages 35 to 44 years Correlation Summary
| Measurement | Houma | French |
| Minimum | 0.70% | 3.9% |
| Maximum | 89.8% | 54.1% |
| Range | 89.1% | 50.2% |
| Mean | 10.5% | 8.9% |
| Median | 5.6% | 6.1% |
| Interquartile 25% (IQ1) | 3.5% | 4.8% |
| Interquartile 75% (IQ3) | 7.8% | 8.3% |
| Interquartile Range (IQR) | 4.3% | 3.5% |
| Standard Deviation (Sample) | 19.3% | 8.2% |
| Standard Deviation (Population) | 18.9% | 8.1% |
Similar Demographics by Unemployment Among Ages 35 to 44 years
Demographics Similar to Houma by Unemployment Among Ages 35 to 44 years
In terms of unemployment among ages 35 to 44 years, the demographic groups most similar to Houma are Puerto Rican (7.6%, a difference of 2.7%), Sioux (8.4%, a difference of 6.9%), Apache (8.4%, a difference of 7.2%), Tohono O'odham (8.4%, a difference of 7.6%), and Native/Alaskan (7.3%, a difference of 8.0%).
| Demographics | Rating | Rank | Unemployment Among Ages 35 to 44 years |
| Cape Verdeans | 0.0 /100 | #327 | Tragic 6.6% |
| Shoshone | 0.0 /100 | #328 | Tragic 6.6% |
| Paiute | 0.0 /100 | #329 | Tragic 6.9% |
| Immigrants | Cabo Verde | 0.0 /100 | #330 | Tragic 6.9% |
| Pueblo | 0.0 /100 | #331 | Tragic 7.1% |
| Natives/Alaskans | 0.0 /100 | #332 | Tragic 7.3% |
| Puerto Ricans | 0.0 /100 | #333 | Tragic 7.6% |
| Houma | 0.0 /100 | #334 | Tragic 7.8% |
| Sioux | 0.0 /100 | #335 | Tragic 8.4% |
| Apache | 0.0 /100 | #336 | Tragic 8.4% |
| Tohono O'odham | 0.0 /100 | #337 | Tragic 8.4% |
| Cheyenne | 0.0 /100 | #338 | Tragic 8.5% |
| Inupiat | 0.0 /100 | #339 | Tragic 8.6% |
| Alaskan Athabascans | 0.0 /100 | #340 | Tragic 8.6% |
| Hopi | 0.0 /100 | #341 | Tragic 8.9% |
Demographics Similar to French by Unemployment Among Ages 35 to 44 years
In terms of unemployment among ages 35 to 44 years, the demographic groups most similar to French are Peruvian (4.7%, a difference of 0.090%), German Russian (4.7%, a difference of 0.11%), Immigrants from Morocco (4.7%, a difference of 0.12%), Arab (4.7%, a difference of 0.18%), and Pennsylvania German (4.7%, a difference of 0.19%).
| Demographics | Rating | Rank | Unemployment Among Ages 35 to 44 years |
| Albanians | 63.0 /100 | #159 | Good 4.6% |
| Hungarians | 62.6 /100 | #160 | Good 4.6% |
| Celtics | 61.7 /100 | #161 | Good 4.7% |
| Costa Ricans | 59.6 /100 | #162 | Average 4.7% |
| South Africans | 58.5 /100 | #163 | Average 4.7% |
| Immigrants | Morocco | 57.2 /100 | #164 | Average 4.7% |
| German Russians | 57.2 /100 | #165 | Average 4.7% |
| French | 55.6 /100 | #166 | Average 4.7% |
| Peruvians | 54.4 /100 | #167 | Average 4.7% |
| Arabs | 53.1 /100 | #168 | Average 4.7% |
| Pennsylvania Germans | 53.0 /100 | #169 | Average 4.7% |
| Immigrants | Indonesia | 52.6 /100 | #170 | Average 4.7% |
| Indonesians | 51.7 /100 | #171 | Average 4.7% |
| Lebanese | 51.4 /100 | #172 | Average 4.7% |
| Iraqis | 50.9 /100 | #173 | Average 4.7% |