Italian vs Serbian Unemployment Among Ages 16 to 19 years
COMPARE
Italian
Serbian
Unemployment Among Ages 16 to 19 years
Unemployment Among Ages 16 to 19 years Comparison
Italians
Serbians
17.0%
UNEMPLOYMENT AMONG AGES 16 TO 19 YEARS
94.5/ 100
METRIC RATING
104th/ 347
METRIC RANK
16.7%
UNEMPLOYMENT AMONG AGES 16 TO 19 YEARS
98.7/ 100
METRIC RATING
69th/ 347
METRIC RANK
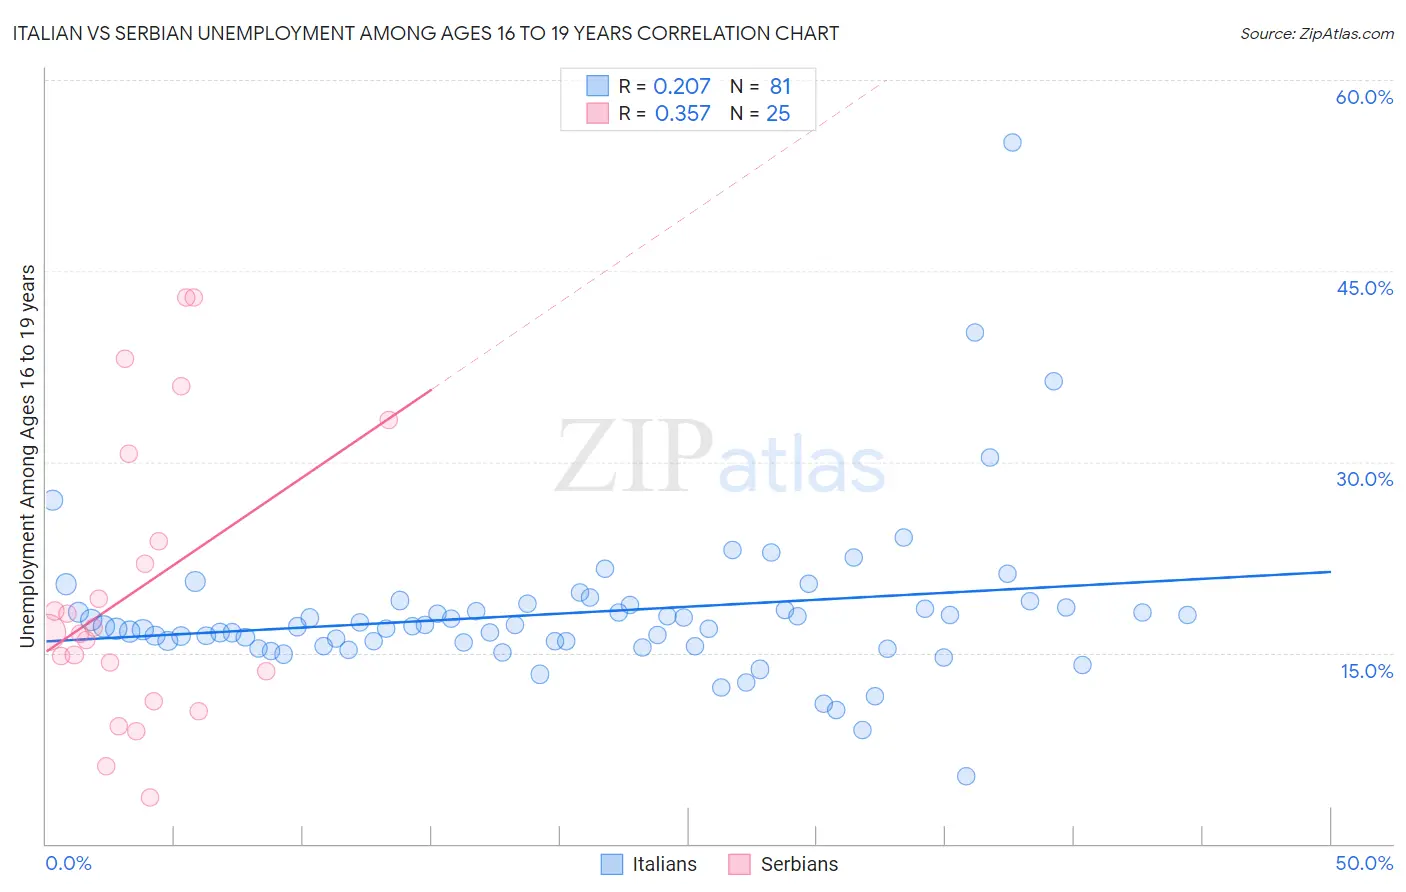
Italian vs Serbian Unemployment Among Ages 16 to 19 years Correlation Chart
The statistical analysis conducted on geographies consisting of 511,046,251 people shows a weak positive correlation between the proportion of Italians and unemployment rate among population between the ages 16 and 19 in the United States with a correlation coefficient (R) of 0.207 and weighted average of 17.0%. Similarly, the statistical analysis conducted on geographies consisting of 256,290,182 people shows a mild positive correlation between the proportion of Serbians and unemployment rate among population between the ages 16 and 19 in the United States with a correlation coefficient (R) of 0.357 and weighted average of 16.7%, a difference of 1.8%.
Unemployment Among Ages 16 to 19 years Correlation Summary
| Measurement | Italian | Serbian |
| Minimum | 5.3% | 3.6% |
| Maximum | 55.1% | 42.9% |
| Range | 49.8% | 39.3% |
| Mean | 18.1% | 19.9% |
| Median | 17.1% | 16.6% |
| Interquartile 25% (IQ1) | 15.7% | 12.4% |
| Interquartile 75% (IQ3) | 18.7% | 27.2% |
| Interquartile Range (IQR) | 3.0% | 14.8% |
| Standard Deviation (Sample) | 6.4% | 11.2% |
| Standard Deviation (Population) | 6.3% | 10.9% |
Similar Demographics by Unemployment Among Ages 16 to 19 years
Demographics Similar to Italians by Unemployment Among Ages 16 to 19 years
In terms of unemployment among ages 16 to 19 years, the demographic groups most similar to Italians are Palestinian (17.0%, a difference of 0.0%), Immigrants from Pakistan (17.0%, a difference of 0.020%), Immigrants from Thailand (17.0%, a difference of 0.040%), Immigrants from Saudi Arabia (17.0%, a difference of 0.040%), and Immigrants from Bulgaria (17.0%, a difference of 0.050%).
| Demographics | Rating | Rank | Unemployment Among Ages 16 to 19 years |
| Immigrants | Venezuela | 95.3 /100 | #97 | Exceptional 16.9% |
| Burmese | 95.0 /100 | #98 | Exceptional 17.0% |
| Immigrants | Lithuania | 94.9 /100 | #99 | Exceptional 17.0% |
| Immigrants | Thailand | 94.7 /100 | #100 | Exceptional 17.0% |
| Immigrants | Saudi Arabia | 94.7 /100 | #101 | Exceptional 17.0% |
| Immigrants | Pakistan | 94.6 /100 | #102 | Exceptional 17.0% |
| Palestinians | 94.6 /100 | #103 | Exceptional 17.0% |
| Italians | 94.5 /100 | #104 | Exceptional 17.0% |
| Immigrants | Bulgaria | 94.3 /100 | #105 | Exceptional 17.0% |
| Estonians | 94.3 /100 | #106 | Exceptional 17.0% |
| Immigrants | Brazil | 94.2 /100 | #107 | Exceptional 17.0% |
| Malaysians | 94.2 /100 | #108 | Exceptional 17.0% |
| Iranians | 94.1 /100 | #109 | Exceptional 17.0% |
| Immigrants | Netherlands | 93.9 /100 | #110 | Exceptional 17.0% |
| Immigrants | Asia | 93.9 /100 | #111 | Exceptional 17.0% |
Demographics Similar to Serbians by Unemployment Among Ages 16 to 19 years
In terms of unemployment among ages 16 to 19 years, the demographic groups most similar to Serbians are Austrian (16.7%, a difference of 0.060%), Chickasaw (16.7%, a difference of 0.070%), Slavic (16.7%, a difference of 0.080%), Latvian (16.7%, a difference of 0.13%), and Immigrants from Canada (16.7%, a difference of 0.16%).
| Demographics | Rating | Rank | Unemployment Among Ages 16 to 19 years |
| Macedonians | 99.2 /100 | #62 | Exceptional 16.6% |
| Scotch-Irish | 99.1 /100 | #63 | Exceptional 16.6% |
| Northern Europeans | 99.0 /100 | #64 | Exceptional 16.6% |
| Immigrants | Japan | 98.9 /100 | #65 | Exceptional 16.6% |
| Okinawans | 98.9 /100 | #66 | Exceptional 16.6% |
| Slavs | 98.7 /100 | #67 | Exceptional 16.7% |
| Chickasaw | 98.7 /100 | #68 | Exceptional 16.7% |
| Serbians | 98.7 /100 | #69 | Exceptional 16.7% |
| Austrians | 98.6 /100 | #70 | Exceptional 16.7% |
| Latvians | 98.5 /100 | #71 | Exceptional 16.7% |
| Immigrants | Canada | 98.5 /100 | #72 | Exceptional 16.7% |
| Lithuanians | 98.2 /100 | #73 | Exceptional 16.7% |
| Immigrants | Eastern Africa | 98.1 /100 | #74 | Exceptional 16.8% |
| New Zealanders | 98.0 /100 | #75 | Exceptional 16.8% |
| Immigrants | North America | 97.9 /100 | #76 | Exceptional 16.8% |